Intel Hardware P-State (aka Harware Controlled Performance or "Speed Shift") (HWP) is a feature found in more modern x86 Intel CPUs (Skylake onwards). It attempts to select the best CPU frequency and voltage to match the optimal power efficiency for the desired CPU performance. HWP is more responsive than the older operating system controlled methods and should therefore be more effective.
To test this theory, I exercised my Lenovo T480 i5-8350U 8 thread CPU laptop with the stress-ng cpu stressor using the "double" precision math stress method, exercising 1 to 8 of the CPU threads over a 60 second test run. The average CPU temperature and average CPU frequency were measured using powerstat and the CPU compute throughput was measured using the stress-ng bogo-ops count.
The HWP mode was set using the x86_energy_perf_policy tool (as found in the Linux source in tools/power/x86/x86_energy_perf_policy). This allows one to select one of 5 policies: "normal", "performance", "balance-performance", "balance-power" and "power" as well as enabling or disabling turbo frequencies. For the tests, turbo mode was also enabled to allow the CPU to run at higher CPU turbo frequencies.
The "performance" policy is the least efficient option as the CPU is clocked at a high frequency even when the system is idle and is not idea for a laptop. The "power" policy will optimize for low power; on my system it set the CPU to a maximum of 400MHz which is not ideal for typical uses.
The more useful "balance-performance" option optimizes for good throughput at the cost of power consumption where as the "balance-power" option optimizes for good power consumption in preference to performance, so I tested these two options.
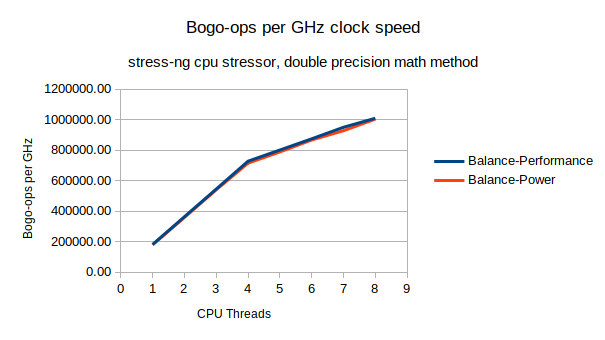
Comparison #1, CPU throughput (bogo-ops) vs CPU frequency.
The two HWP policies are almost identical in CPU bogo-ops throughput vs CPU frequency. This is hardly surprising - the compute throughput for math intensive operations should scale with CPU clock frequency. Note that 5 or more CPU threads sees a reduction in compute throughput because the CPU hyper-threads are being used.
Comparison #2, CPU package temperature vs CPU threads used.
Not a big surprise, the more CPU threads being exercised the hotter the CPU package will get. The balance-power policy shows a cooler running CPU than the balance-performance policy. The balance-performance policy is running hot even when one or a few threads are being used.
Comparison #3, Power consumed vs CPU threads used.
Clearly the balance-performance option is consuming more power than balance-power, this matches the CPU temperature measurements too. More power, higher temperature.
Comparison #4, Maximum CPU frequency vs CPU threads used.
With the balance-performance option, the average maximum CPU frequency drops as more CPU threads are used. Intel turbo boost allows one to clock a few CPUs to higher frequencies, exercising more CPUs leads to more power and hence more heat. To keep the CPU package from hitting thermal overrun, CPU frequency and voltage has to be scaled down when using more CPUs.
This also is true (but far less pronounced) for the balance-power option. As once can see, balance-performance runs the CPU at a much higher frequency, which is great for compute at the expense of power consumption and heat.
Comparison #5, Compute throughput vs power consumed.
So running with the balance-performance runs the CPU at higher speed and hence one gets more compute throughput per unit of time compared to the balance-power mode. That's great if your laptop is plugged into the mains and you want to get some compute intensive tasks performed quickly. However, is this more efficient?
Comparing the amount of compute performance with the power consumed shows that the balance-power option is more efficient than balance-performance. Basically with balance-power more compute is possible with the same amount of energy compared to balance-performance, but it will take longer to complete.
CPU frequency scaling over time
The 60 second duration tests were long enough for the CPU to warm up enough reach thermal limits causing HWP to throttle back the voltage and CPU frequencies. The following graphs illustrate how running with the balance-performance option allows the CPU to run for several seconds at a high turbo frequency before it hits a thermal limit and then the CPU frequency and power is adjusted to avoid thermal overrun:
After 8 seconds the CPU package reached 92 degrees C and then CPU frequency scaling kicks in:
..and power consumption drops too:
..it is interesting to note that we can only run for ~9 seconds before the CPU is scaled back to around the same CPU frequency that the balance-power option allows.
Conclusion
Running with HWP balance-power option is a good default choice for maximizing compute while minimizing power consumption for a modern Intel based laptop. If one wants to crank up the performance at the expense of battery life, then the balance-performance option is most useful.
The balance-performance option when a laptop is plugged into the mains (e.g. via a base-station) may seem like a good idea to get peak compute performance. Note that this may not be useful in the long term as the CPU frequency
may drop back to reduce thermal overrun. However, for bursty infrequent
demanding CPU uses this may be a good choice. I personally refrain from using this as it makes my CPU rather run hot and it's less efficient so it's not ideal for reducing my carbon footprint.
Laptop manufacturers normally set the default HWP option as "balance-power", but this may be changed in the BIOS settings (look for power balance, HWP or Speed Shift options) or changed with x86_energy_perf_policy tool (found in the linux-tools-generic package in Ubuntu).


