Friday, 26 March 2010

Installing Intel Microcode Updates

It is not unknown for personal computers to be shipped with subtle and rarely occurring bugs in the x86 processor. Normally these bugs can be fixed with microcode updates that get loaded by the BIOS at boot time. However, re-flashing a BIOS may be deemed to risky (since it can brick a machine) or perhaps one can no longer get BIOS updates to an older machine.

This is where the Intel microcode updates come in useful. To install these on Ubuntu use:

sudo apt-get install intel-microcode

These may then fix subtle bugs, so it's always worth a try when you see strange processor related issues such inexplicable memory related oopses.

The caveat is that the microcode is loaded late in boot time, so you may not be able to workaround bugs in the early boot phase. For example, when coming out of hibernate you may hit a processor related bug that's fixed with the microcode update - however, the microcode is loaded late into the resume from hibernate phase, so it cannot be fixed this way.

Sunday, 21 March 2010

Debugging ACPI using acpiexec

The acpiexec tool is an AML emulator that allows one to execute and interactively ACPI AML code from your BIOS.  The tarball can be downloaded from the ACPICA website  and built as follows:

1. Unzip and untar the acica-unix-20100304.tar.gz tarball.
2. cd into tools/acpiexec
3. run make

This should build acpiexec. Now for the fun part - executing your ACPI inside the emulator. To do this grab your ACPI tables and extract them using:
sudo acpidump > acpi.info && acpixtract -a acpi.info

Now load these tables into the emulator and run with verbose mode:

./acpiexec -v *.dat

Inside the emulator you can type help to navigate around the help system.  It may take a little bit of work to get familiar with all the commands available.

As a quick introduction, here is how to execute the battery information _BIF method.

1. Get a list of all the available methods, type:

methods

on my Lenovo laptop the battery information method is labelled \_SB_.PCI0.LPCB.BAT1._BIF, so to execute this method I use:

execute \_SB_.PCI0.LPCB.BAT1._BIF
Executing \_SB_.PCI0.LPCB.BAT1._BIF
Execution of \_SB_.PCI0.LPCB.BAT1._BIF returned object 0x19669d0 Buflen 178
  [Package] Contains 13 Elements:
    [Integer] = 0000000000000001
    [Integer] = 0000000000000FA0
    [Integer] = 0000000000000FA0
    [Integer] = 0000000000000001
    [Integer] = 0000000000002B5C
    [Integer] = 00000000000001A4
    [Integer] = 000000000000009C
    [Integer] = 0000000000000108
    [Integer] = 0000000000000EC4
    [String] Length 08 = PA3465U
    [String] Length 05 = 3658Q
    [String] Length 06 = Li-Ion
    [String] Length 07 = COMPAL

So far so good. I single stepped through the code using the debug command on the method as follows:

debug \_SB_.PCI0.LPCB.BAT1._BIF

at each % prompt, one can press enter to step the next instruction. If the method requires arguments, these can be passed into the method by specifying them after the method name from the debug command.

To see any local variables used during execution, use the locals command. The list command lists the current AML instructions. The set commands allows one to set method data and interact with the debugging processes.

Hopefully this gives one a taste of what the emulator can do. The internal help is enough to get one up and running, and one does generally require the current ACPI specification to figure out what's happening in your ACPI tables.
Perf tool now in Ubuntu Lucid.

A few months ago I blogged about the perf tool and how useful it is to drill down into kernel and user space applications to analyse performance bottle necks. Well, thanks to Andy Whitcroft, the perf tool is now available in Ubuntu Lucid. Perf needs to be in lock-step with the kernel, which complicated the packaging of this tool.

To install, use:

sudo apt-get install linux-tools

and this installs the perf, perf-stat, perf-top, perf-record, perf-report and perf-list tools.

The author of perf, Ingo Molnar has written some basic instructions on driving perf in the tools/perf/Documentation/example.txt file. They should give one a feel of how to drive these tools.

For example, to examine google-chrome:

perf record google-chrome

... run a test and then exit, and then generate a summary of activity:


perf report

One can examine specific events in the system too. To get a list of available events use:

perf list

For example, to measure CPU cycles, number of instructions, context switches and kmallocs on google-chrome one uses:

perf stat -e cpu-cycles -e instructions -e context-switches -e kmem:kmalloc google-chrome

Performance counter stats for 'google-chrome':

15576472832 cycles # 0.000 M/sec
13466330277 instructions # 0.865 IPC
40791 context-switches # 0.000 M/sec
38602 kmem:kmalloc # 0.000 M/sec

18.062301718 seconds time elapsed

One more quick example, this time we record a call-graph (stack chain/backtrace) of the dd command:

perf record -g dd if=/dev/zero of=/dev/null bs=1M count=4096
and get the call graph using:

# Samples: 12584 # # Overhead Command Shared Object Symbol # ........ ............... ............................... ...... # 95.96% dd [kernel] [k] __clear_user | |--99.69%-- read_zero | vfs_read | sys_read | system_call_fastpath | __read --0.31%-- [...]
1.37% dd [kernel] [k] read_zero 0.87% dd [kernel] [k] _cond_resched | |--50.91%-- read_zero | vfs_read | sys_read | system_call_fastpath | __read
..etc.

I recommend reading Ingo's example.txt and playing around with this tool. It is very powerful and allows one to drill down and examine system performance right down to the instruction level.

Friday, 19 March 2010

Reading the TSC from userspace

Recently I've been poking around looking at some Time Stamp Counter (TSC) anomalies when coming out of suspend. So what is the TSC? It's a 64 bit high resolution tick counter found on X86 processors (since Pentiums) and can be read using the rdtsc instruction.

It is intended to be a fast method of getting a high resolution timer. However it is known to problematic on multi-core and hyperthreaded CPUs - one needs to be locked to one CPU to get reliable results since the TSC may be different on each CPU. It is also known to reset when coming out of resume which means time can look like it goes backwards in a huge jump.

If the CPU speed is changed then the TSC rate can change too. If you have a more recent Intel CPU where the constant_tsc flag is set (see /proc/cpuinfo) then the TSC will run at a constant rate no matter the CPU speed - but this means that benchmarking with the constant TSC may make programs look like they use more CPU cycles than in reality!

Anyhow, getting the 64 bit TSC value is a simple case of using the rdtsc instruction. I've got some example code to do this here with the necessary inlined assembler magic to handle this correctly for 32 and 64 bit builds.

Saturday, 6 March 2010

Tweaking the Gnome Window Button Layout

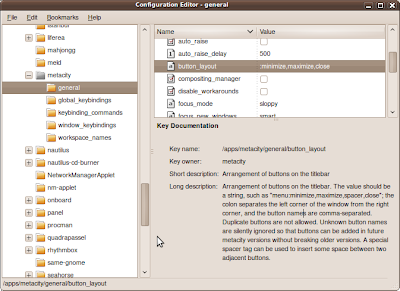
Call me old fashioned, but I kind of like my Gnome Window buttons to be on the right hand side of a Window, rather than on the left. Fortunately this can be easily configured using gconf-editor. Run gconf-editor and select: apps->metacity->general and then select the button_layout configuration setting and change it to:

:minimize,maximize,close

The leading colon sets the button icons on the right of a window and a trailing colon sets the button icons on the left of a window. Easy!


If you don't want to run the GUI tool, use the following rune:

gconftool-2 --type string --set /apps/metacity/general/button_layout :minimize,maximize,close