Showing posts with label benchmarking. Show all posts

Thursday, 22 June 2017

Cyclic latency measurements in stress-ng V0.08.06

The stress-ng logo
The latest release of stress-ng contains a mechanism to measure latencies via a cyclic latency test.  Essentially this is just a loop that cycles around performing high precisions sleeps and measures the (extra overhead) latency taken to perform the sleep compared to expected time.  This loop runs with either one of the Round-Robin (rr) or First-In-First-Out real time scheduling polices.

The cyclic test can be configured to specify the sleep time (in nanoseconds), the scheduling type (rr or fifo),  the scheduling priority (1 to 100) and also the sleep method (explained later).

The first 10,000 latency measurements are used to compute various latency statistics:
  • mean latency (aka the 'average')
  • modal latency (the most 'popular' latency)
  • minimum latency
  • maximum latency
  • standard deviation
  • latency percentiles (25%, 50%, 75%, 90%, 95.40%, 99.0%, 99.5%, 99.9% and 99.99%
  • latency distribution (enabled with the --cyclic-dist option)
The latency percentiles indicate the latency at which a percentage of the samples fall into.  For example, the 99% percentile for the 10,000 samples is the latency at which 9,900 samples are equal to or below.

The latency distribution is shown when the --cyclic-dist option is used; one has to specify the distribution interval in nanoseconds and up to the first 100 values in the distribution are output.

For an idle machine, one can invoke just the cyclic measurements with stress-ng as follows:

 sudo stress-ng --cyclic 1 --cyclic-policy fifo \
--cyclic-prio 100 --cyclic-method --clock_ns \
--cyclic-sleep 20000 --cyclic-dist 1000 -t 5  
 stress-ng: info: [27594] dispatching hogs: 1 cyclic  
 stress-ng: info: [27595] stress-ng-cyclic: sched SCHED_FIFO: 20000 ns delay, 10000 samples  
 stress-ng: info: [27595] stress-ng-cyclic:  mean: 5242.86 ns, mode: 4880 ns  
 stress-ng: info: [27595] stress-ng-cyclic:  min: 3050 ns, max: 44818 ns, std.dev. 1142.92  
 stress-ng: info: [27595] stress-ng-cyclic: latency percentiles:  
 stress-ng: info: [27595] stress-ng-cyclic:  25.00%:    4881 us  
 stress-ng: info: [27595] stress-ng-cyclic:  50.00%:    5191 us  
 stress-ng: info: [27595] stress-ng-cyclic:  75.00%:    5261 us  
 stress-ng: info: [27595] stress-ng-cyclic:  90.00%:    5368 us  
 stress-ng: info: [27595] stress-ng-cyclic:  95.40%:    6857 us  
 stress-ng: info: [27595] stress-ng-cyclic:  99.00%:    8942 us  
 stress-ng: info: [27595] stress-ng-cyclic:  99.50%:    9821 us  
 stress-ng: info: [27595] stress-ng-cyclic:  99.90%:   22210 us  
 stress-ng: info: [27595] stress-ng-cyclic:  99.99%:   36074 us  
 stress-ng: info: [27595] stress-ng-cyclic: latency distribution (1000 us intervals):  
 stress-ng: info: [27595] stress-ng-cyclic: latency (us) frequency  
 stress-ng: info: [27595] stress-ng-cyclic:           0         0  
 stress-ng: info: [27595] stress-ng-cyclic:        1000         0  
 stress-ng: info: [27595] stress-ng-cyclic:        2000         0  
 stress-ng: info: [27595] stress-ng-cyclic:        3000        82  
 stress-ng: info: [27595] stress-ng-cyclic:        4000      3342  
 stress-ng: info: [27595] stress-ng-cyclic:        5000      5974  
 stress-ng: info: [27595] stress-ng-cyclic:        6000       197  
 stress-ng: info: [27595] stress-ng-cyclic:        7000       209  
 stress-ng: info: [27595] stress-ng-cyclic:        8000       100  
 stress-ng: info: [27595] stress-ng-cyclic:        9000        50  
 stress-ng: info: [27595] stress-ng-cyclic:       10000        10  
 stress-ng: info: [27595] stress-ng-cyclic:       11000         9  
 stress-ng: info: [27595] stress-ng-cyclic:       12000         2  
 stress-ng: info: [27595] stress-ng-cyclic:       13000         2  
 stress-ng: info: [27595] stress-ng-cyclic:       14000         1  
 stress-ng: info: [27595] stress-ng-cyclic:       15000         9  
 stress-ng: info: [27595] stress-ng-cyclic:       16000         1  
 stress-ng: info: [27595] stress-ng-cyclic:       17000         1  
 stress-ng: info: [27595] stress-ng-cyclic:       18000         0  
 stress-ng: info: [27595] stress-ng-cyclic:       19000         0  
 stress-ng: info: [27595] stress-ng-cyclic:       20000         0  
 stress-ng: info: [27595] stress-ng-cyclic:       21000         1  
 stress-ng: info: [27595] stress-ng-cyclic:       22000         1  
 stress-ng: info: [27595] stress-ng-cyclic:       23000         0  
 stress-ng: info: [27595] stress-ng-cyclic:       24000         1  
 stress-ng: info: [27595] stress-ng-cyclic:       25000         2  
 stress-ng: info: [27595] stress-ng-cyclic:       26000         0  
 stress-ng: info: [27595] stress-ng-cyclic:       27000         1  
 stress-ng: info: [27595] stress-ng-cyclic:       28000         1  
 stress-ng: info: [27595] stress-ng-cyclic:       29000         2  
 stress-ng: info: [27595] stress-ng-cyclic:       30000         0  
 stress-ng: info: [27595] stress-ng-cyclic:       31000         0  
 stress-ng: info: [27595] stress-ng-cyclic:       32000         0  
 stress-ng: info: [27595] stress-ng-cyclic:       33000         0  
 stress-ng: info: [27595] stress-ng-cyclic:       34000         0  
 stress-ng: info: [27595] stress-ng-cyclic:       35000         0  
 stress-ng: info: [27595] stress-ng-cyclic:       36000         1  
 stress-ng: info: [27595] stress-ng-cyclic:       37000         0  
 stress-ng: info: [27595] stress-ng-cyclic:       38000         0  
 stress-ng: info: [27595] stress-ng-cyclic:       39000         0  
 stress-ng: info: [27595] stress-ng-cyclic:       40000         0  
 stress-ng: info: [27595] stress-ng-cyclic:       41000         0  
 stress-ng: info: [27595] stress-ng-cyclic:       42000         0  
 stress-ng: info: [27595] stress-ng-cyclic:       43000         0  
 stress-ng: info: [27595] stress-ng-cyclic:       44000         1  
 stress-ng: info: [27594] successful run completed in 5.00s  
   

Note that stress-ng needs to be invoked using sudo to enable the Real Time FIFO scheduling for the cyclic measurements.

The above example uses the following options:

  • --cyclic 1
    • starts one instance of the cyclic measurements (1 is always recommended)
  • --cyclic-policy fifo 
    • use the real time First-In-First-Out scheduling for the cyclic measurements
  • --cyclic-prio 100 
    • use the maximum scheduling priority  
  • --cyclic-method clock_ns
    • use the clock_nanoseconds(2) system call to perform the high precision duration sleep
  • --cyclic-sleep 20000 
    • sleep for 20000 nanoseconds per cyclic iteration
  • --cyclic-dist 1000 
    • enable latency distribution statistics with an interval of 1000 nanoseconds between each data point.
  • -t 5
    • run for just 5 seconds
From the run above, we can see that 99.5% of latencies were less than 9821 nanoseconds and most clustered around the 4880 nanosecond model point. The distribution data shows that there is some clustering around the 5000 nanosecond point and the samples tail off with a bit of a long tail.

Now for the interesting part. Since stress-ng is packed with many different stressors we can run these while performing the cyclic measurements, for example, we can tell stress-ng to run *all* the virtual memory related stress tests and see how this affects the latency distribution using the following:

 sudo stress-ng --cyclic 1 --cyclic-policy fifo \  
 --cyclic-prio 100 --cyclic-method clock_ns \  
 --cyclic-sleep 20000 --cyclic-dist 1000 \  
 --class vm --all 1 -t 60s  
   

..the above invokes all the vm class of stressors to run all at the same time (with just one instance of each stressor) for 60 seconds.

The --cyclic-method specifies the delay used on each of the 10,000 cyclic iterations used.  The default (and recommended method) is clock_ns, using the high precision delay.  The available cyclic delay methods are:
  • clock_ns (use the clock_nanosecond() sleep)
  • posix_ns (use the POSIX nanosecond() sleep)
  • itimer (use a high precision clock timer and pause to wait for a signal to measure latency)
  • poll (busy spin-wait on clock_gettime() to eat cycles for a delay.
All the delay mechanisms use the CLOCK_REALTIME system clock for timing.

I hope this is plenty of cyclic measurement functionality to get some useful latency benchmarks against various kernel components when using some or a mix of the stress-ng stressors.  Let me know if I am missing some other cyclic measurement options and I can see if I can add them in.

Keep stressing and measuring those systems!

Saturday, 13 October 2012

Intel rdrand instruction revisited

A few months ago I did a quick and dirty benchmark of the Intel rdrand instruction found on the new Ivybridge processors.  I did some further analysis a while ago and I've only just got around to writing up my findings. I've improved the test by exercising the Intel Digital Random Number Generator (DRNG) with multiple threads and also re-writing the rdrand wrapper in assembler and ensuring the code is inline'd.  The source code for this test is available here.

So, how does it shape up?  On a i5-3210M (2.5GHz) Ivybridge (2 cores, 4 threads) I get a peak of ~99.6 million 64 bit rdrands per second with 4 threads which equates to ~6.374 billion bits per second.  Not bad at all.

With a 4 threaded i5-3210M CPU we hit maximum rdrand throughput with 4 threads.

..and with a 8 threaded i7-3770 (3.4GHz) Ivybridge (4 cores, 8 threads) we again hit a peak throughput of 99.6 million 64 bit rdrands a second on 3 threads. One can therefore conclude that this is the peak rate of the DNRG on both CPUs tested.  A 2 threaded i3 Ivybridge CPU won't be able to hit the peak rate of the DNRG, and a 4 threaded i5 can only just max out the DNRG with some hand-optimized code.

Now how random is this random data?  There are several tests available; I chose to exercise the DRNG using the dieharder test suite.  The test is relatively simple; install dieharder and do 64 bit rdrand reads and output these as a raw random number stream and pipe this into dieharder:

 sudo apt-get install dieharder  
 ./rdrand-test | dieharder -g 200 -a
#=============================================================================#
#            dieharder version 3.31.1 Copyright 2003 Robert G. Brown          #
#=============================================================================#
   rng_name    |rands/second|   Seed   |
stdin_input_raw|  3.66e+07  | 639263374|
#=============================================================================#
        test_name   |ntup| tsamples |psamples|  p-value |Assessment
#=============================================================================#
   diehard_birthdays|   0|       100|     100|0.40629140|  PASSED  
      diehard_operm5|   0|   1000000|     100|0.79942347|  PASSED  
  diehard_rank_32x32|   0|     40000|     100|0.35142889|  PASSED  
    diehard_rank_6x8|   0|    100000|     100|0.75739694|  PASSED  
   diehard_bitstream|   0|   2097152|     100|0.65986567|  PASSED  
        diehard_opso|   0|   2097152|     100|0.24791918|  PASSED  
        diehard_oqso|   0|   2097152|     100|0.36850828|  PASSED  
         diehard_dna|   0|   2097152|     100|0.52727856|  PASSED  
diehard_count_1s_str|   0|    256000|     100|0.08299753|  PASSED  
diehard_count_1s_byt|   0|    256000|     100|0.31139908|  PASSED  
 diehard_parking_lot|   0|     12000|     100|0.47786440|  PASSED  
    diehard_2dsphere|   2|      8000|     100|0.93639860|  PASSED  
    diehard_3dsphere|   3|      4000|     100|0.43241488|  PASSED  
     diehard_squeeze|   0|    100000|     100|0.99088862|  PASSED  
        diehard_sums|   0|       100|     100|0.00422846|   WEAK   
        diehard_runs|   0|    100000|     100|0.48432365|  PASSED 
..
        dab_monobit2|  12|  65000000|       1|0.98439048|  PASSED 

..and leave to cook for about 45 minutes.  The -g 200 option specifies that the random numbers come from stdin and the -a option runs all the dieharder tests.  All the tests passed with the exception of the diehard_sums test which produced "weak" results, however, this test is known to be unreliable and recommended not to be used.  Quite honestly, I would be surprised if the tests failed, but you never know until one runs them.

The CA cert research labs have an on-line random number generator analysis website allowing one to submit and test at least 12 MB of random numbers. I submitted 32 MB of data, and I am currently waiting to see if I get any results back.  Watch this space.

Monday, 26 October 2009

blktrace based tools - seekwatcher

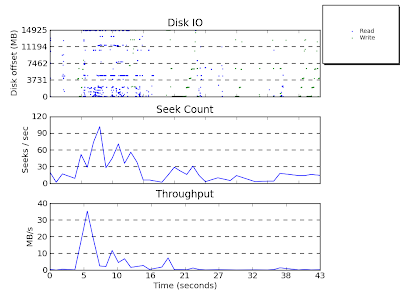
Previously I blogged about blktrace and how it can be used to analyse block I/O operations - however, it can generate a lot of data that can be overwhelming. This is where Chris Mason's Seekwatcher tool comes to the rescue. Seekwatcher uses blktrace data to generate graphs to help one visualise and understand I/O patterns. It allows one to plot multiple blktrace runs together to enable easy comparison between benchmarking test runs.

It requires matplotlib, python and the numpy module - on Ubuntu download and install these packages using:

sudo apt-get install python python-matplotlib python-numpy

and then get the seekwatcher source and extract seekwatcher from the source package and you are ready to run the seekwatcher python script.

Seekwatcher also can general animations of I/O patterns which also improves visualisation and understanding of I/O operations over time.

To use seekwacher, first start a blktrace capture:

blktrace -o trace -d /dev/sda

next kick off the test you want to analyse and when that's complete, kill blktrace. Next run seekwatcher on the blktrace output:

seekwatcher -t trace.blktrace -o output.png

..and this generates a png file output.png. Easy!

Attached is the output from a test I just ran on my HP Mini 1000 starting up the Open Office word processor:

One can generate a movie from the same data using:

seekwatcher -t trace.blktrace -o open-office.mpg --movie

The generated movie is below:


There are more instructions on other ways to use seekwatcher on the seekwatcher webpage. All in all, a very handy tool - kudos to Chris Mason.

Friday, 26 June 2009

Ubuntu Power Saving Improvements

Yesterday I compared power consumption between two different versions of Ubuntu. I dual boot installed Ubuntu Intrepid and Jaunty on a Dell Inspiron 6400 laptop (Dual core 1.6GHz, 1MB RAM) and installed powertop and also DVD reading software using packages from Medibuntu. I then removed the battery from the laptop and plugged the mains power adapter into a power meter to measure power consumption.

My aim was to benchmark the power consumption for three scenarios:

1) Idle for 10 minutes
2) Running Firefox on 3 Flash enabled sites (slashdot.com, news.bbc.co.uk and digg.com) for 10 minutes
3) Playing 4 minutes from a DVD

I ran powertop to look at how much time the system was in the C0 state (CPU running) and to observe the number of Wakeups-from-idle per second. I also installed sensors-applet to monitor CPU and HDD temperature changes during the benchmarking.

In the Idle case, Intrepid was waking up ~60.5 times a second and drawing 30.0 Watts while Jaunty was waking up ~56.8 times a second and drawing 29.2 Watts, so there was some power saving improvement with Jaunty. CPU temperatures were comparable at 42 degrees C (which is quite hot!). There was very little difference between times in C0 (running) states between Intrepid and Jaunty.

For the Firefox test the number of wakeups was difficult to get a stable measurement, since the flash was generating a lot of irregular activity and so it was difficult to compare like for like. Intrepid was drawing ~30.6 Watts and the CPU was ~43.5 degrees C, where as for Jaunty I observed ~29.3 Watts and a higher temperature of ~45.4 degrees C, which is a little perplexing.

Finally, for the VLC DVD playing test. Intrepid drew 35.7 Watts and the CPU warmed to 49.3 degrees C while Jaunty drew 35.0 Watts and warmed to 51.8 degrees C (again a little perplexing why it's warmer and drew less power overall).

From my crude set of tests we can see that Jaunty does seem to show some power improvements in all three test scenarios. As yet, I'm perplexed why Jaunty is drawing less power but the CPU is getting slightly warmer in the non-idle tests; this needs further investigation (any ideas why?)

Sunday, 14 June 2009

Does pre-linking speed up boot times?

Pre-linking binaries is a method of modifying ELF libraries so that the relocation link time overhead is performed not at load time and hence theoretically speeding up program start time (see the Wikipedia entry for more details).


To test this, I installed Karmic 9.10 Alpha 2 on a Dell Inspiron 6400 laptop using ext4 as my default file system and added some instrumentation to measure the time from when the first rc scripts are started to the time the desktop completes loading when auto-logging in.


First, I measured the startup time 5 times without prelinking; this came to an average of 16.397 seconds with a standard deviation of 0.21 seconds.

Next I installed prelink and pre-linked all the system libraries (which takes ~5 minutes) using the following recipe:

  1. apt-get install prelinkuse apt-get or synaptic to install prelink.
  2. Open /etc/default/prelink with your favorite editor, using sudo
  3. Modify PRELINKING=unknown from unknown to yes
  4. Start the first prelink by running: sudo /etc/cron.daily/prelink
Then I repeated the boot time measurements with prelinking enabled; this came to an average of 16.343 seconds with a standard deviation of 0.09 seconds.

So I am seeing tiny ~0.33% speed up of 0.054 seconds which is within the margin of measuring error. All in all this took me ~1.5 hours to set up and measure, which means that if I boot my laptop once a day it will take me 274 years before I start saving time :-)

All in all it's not really worth enabling prelinking. At least I now know!

(Note: pre-linking may be considered a security issue, as Ubuntu makes use of randomizing the start of code to make it more difficult for rogue programs to exploit.)

I suspect that if the processor was significantly slower and there was less I/O delay (perhaps using SSD rather than HDD) I may actually see more of a significant speed up since prelinking saves some CPU cycles. I speculate that prelinking may be therefore worth considering on lower speed or less powerful platforms such as ARM or Intel Atom based machines.

The next test will be to see if large applications that use tens of libraries start up faster...

Friday, 12 June 2009

Bonnie++, a useful benchmarking tool

When it comes to figuring out how a file system behaves on a HDD or SSD I generally first turn to Bonnie++ as a straight forward and easy to use disk benchmarking tool.

Bonnie performs a series of tests, covering character and block read/write I/O, database style I/O operations as well as tests for multiple file creation/deletion and some random access I/O operations.

To install bonnie for Ubuntu, simply do:

sudo apt-get install bonnie

To get a fair I/O benchmark (without the memory cache interfering with results) Bonnie generates test files that are at least twice the size of the memory of your machine. This can be a problem if you have servers with a lot of memory as the generated files can be huge and testing can therefore take quite a while. I generally boot a system and specify ~1GB of memory using the mem=1024M kernel parameter just so that Bonnie only tests with a 2GB file to speed my testing up.

My rule of thumb is to run Bonnie at least 3 times and take an average of the results. If you see a large variation in your results double check that there isn't some service running that is interfering with the benchmarking.

Bonnie references:

http://www.coker.com.au/bonnie++

http://linux.com/archive/feature/139742