I've collected up some nuggets of information which may be useful to help debug various ACPI issues:
These Wiki pages are "work-in-progress", so I welcome any corrections on factual inaccuracies. A lot of the information has been pieced together either information found on the internet, or from the Linux kernel source, or disassembling many ACPI tables and also from a little bit of reverse engineering.
Tuesday, 14 December 2010
Friday, 10 December 2010
Maintainable code.
Writing maintainable code requires considerable effort and there are numerous resources available in the form of books and websites to teach this creative art. One can also glean wisdom from learning from mistakes, and with this mind, I found it instructive to read a tongue-in-cheek article by Roedy Green about how to write unmaintainable code. The article has been around since 1997, but I think it wears well.
Don't misunderstand me, by recommending this article I'm not advocating writing unmaintainable code at all. I just think it can be very useful to see some ingenious ways to make code totally confusing and bamboozling so that one can avoid these at all cost.
Don't misunderstand me, by recommending this article I'm not advocating writing unmaintainable code at all. I just think it can be very useful to see some ingenious ways to make code totally confusing and bamboozling so that one can avoid these at all cost.
Tuesday, 7 December 2010
Lost Circuits article on HDD data transfer rates.
Lost Circuits has written an in-depth article on hard disk media, covering aspects of HDD performance, such as transfer rates depending on the zone position (inner to outer diameters), discrepancies between internal transfer rates and benchmarked rates as well as the impact of track slew.
Some of the internal mechanical magic is also described, which helps explain how manufacturers configure their hardware and sector layouts to maximise performance. All very informative.
The website is slow, so be patient!
Some of the internal mechanical magic is also described, which helps explain how manufacturers configure their hardware and sector layouts to maximise performance. All very informative.
The website is slow, so be patient!
Monday, 6 December 2010
cowsay and cowthink fun
Time for me to lighten up a little. I stumbled upon the cowsay and cowthink commands today while reading the Wikipedia entry about Tux. Cowsay prints an ASCII art picture of a cow and a speach bubble around some provided text, and cowthink puts the text in a think bubble.
cowsay "Well this is all very amusing."
The -f flag allows one to specify different picture, for example -f tux draws Tux instead of a cow.
cowthink -f tux "Why is my kernel building so slowly today?"
There are over 50 pictures to chose from, use cowsay -l to list them all.
To install, use: sudo apt-get install cowsay
Enjoy!
cowsay "Well this is all very amusing."
 ________________________________
< Well this is all very amusing. >
--------------------------------
    \   ^__^
     \  (oo)\_______
        (__)\       )\/\
            ||----w |
            ||     ||
The -f flag allows one to specify different picture, for example -f tux draws Tux instead of a cow.
cowthink -f tux "Why is my kernel building so slowly today?"
 _____________________________________
( Why is my kernel building so slowly )
( today?                              )
-------------------------------------
o
 o
     .--.
    |o_o |
    |:_/ |
   //   \ \
  (|     | )
 /'\_   _/`\
 \___)=(___/
There are over 50 pictures to chose from, use cowsay -l to list them all.
To install, use: sudo apt-get install cowsay
Enjoy!
Tuesday, 23 November 2010
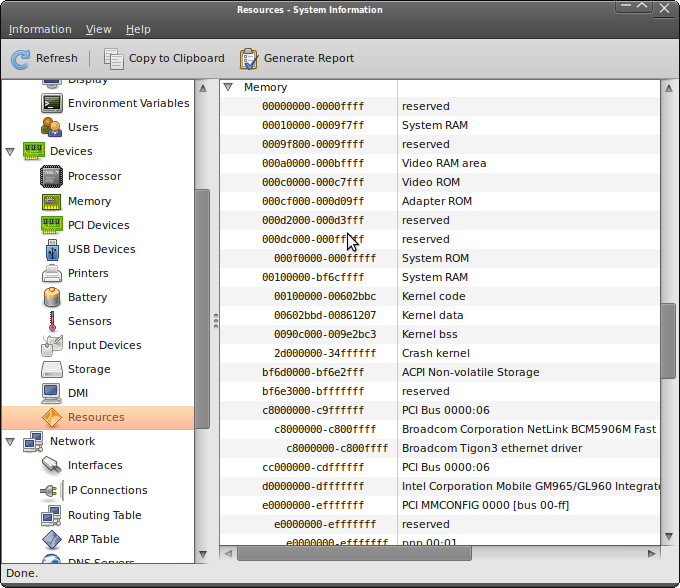
hardinfo - look at hardware information in a GUI
Leandro Pereira has created hardinfo, a useful user-friendly GTK+ utility to browse the hardware information on one's machine. It also includes a bunch of benchmarking tools too.
To install, simply use:
apt-get install hardinfo
and run with Applications->System Tools->System Profiler and Benchmark or run from the command line using:
hardinfo
The tool presents information from /proc and /sys in a very easy to user and clean GUI. The view is broken into four categories:
Computer: OS, kernel modules, filesystem, display, environment variables, users.
Devices: CPU, memory, PCI, USB, printers, battery, sensors, input, storage, DMI, resources.
Network: Interfaces, IP connections, routing tables, ARP table, DNS servers, statistics, shares.
Benchmarks: Blowfish, CryptoHash, Fibonacci, CPU N-Queens, CPU FFT, FPU Raytracing.
Below are some sample views of my machine using hardinfo:


 Quite a handy tool.
Tuesday, 26 October 2010
Int 0x15 e820 and libx86
One of the more obscure libraries I've looked at recently is libx86 which provides some x86 real mode functionality to do tricks such as BIOS calls from user space. The library provides routines to do real mode malloc/free and also a structure to pass/return CPU register to/from an Interrupt call. One uses:
sudo apt-get install libx86-dev
..to install the libx86 devel library.
I experimented with libx86 by using the Int 0x15 AX=0xe820 call to query the system address map. One loads EAX with 0xe820, EBX initially with zero (for the first address map structure), ES:DI with a pointer a 20 byte real mode buffer, ECX with 20 (size of the buffer) and EDX with the signature 'SMAP'. If the carry is set or EBX is zero after the call, then either an error occurred or one has reached the end of the table. After the call, EBX contains a continuation value that is passed back in EBX on the next call. The 20 byte real mode buffer is populated as follows:
sudo ./e820
Base Address Length Type
0000000000000000 000000000009fc00 RAM
000000000009fc00 0000000000000400 Reserved
00000000000e0000 0000000000020000 Reserved
0000000000100000 000000003f6b0000 RAM
000000003f7b0000 000000000000e000 ACPI Reclaim
000000003f7be000 0000000000032000 ACPI NVS memory
000000003f7f0000 0000000000010000 Reserved
00000000fee00000 0000000000001000 Reserved
00000000fff00000 0000000000100000 Reserved
Anyhow, I hope this example shows how to do BIOS interrupts using libx86 from userspace in Linux.
sudo apt-get install libx86-dev
..to install the libx86 devel library.
I experimented with libx86 by using the Int 0x15 AX=0xe820 call to query the system address map. One loads EAX with 0xe820, EBX initially with zero (for the first address map structure), ES:DI with a pointer a 20 byte real mode buffer, ECX with 20 (size of the buffer) and EDX with the signature 'SMAP'. If the carry is set or EBX is zero after the call, then either an error occurred or one has reached the end of the table. After the call, EBX contains a continuation value that is passed back in EBX on the next call. The 20 byte real mode buffer is populated as follows:
 uint32     BaseAddrLo   Lo 32 Bits of Base Address
 uint32     BaseAddrHi   Hi 32 Bits of Base Address
 uint32     LengthLo     Lo 32 Bits of Length in Bytes
 uint32     LengthHi     Hi 32 Bits of Length in Bytes
 uint32     Type         Address type
My implementation to dump out the entire system address map can be found here. Compile and link with libx86 and then run the executable using sudo:
sudo ./e820
Base Address Length Type
0000000000000000 000000000009fc00 RAM
000000000009fc00 0000000000000400 Reserved
00000000000e0000 0000000000020000 Reserved
0000000000100000 000000003f6b0000 RAM
000000003f7b0000 000000000000e000 ACPI Reclaim
000000003f7be000 0000000000032000 ACPI NVS memory
000000003f7f0000 0000000000010000 Reserved
00000000fee00000 0000000000001000 Reserved
00000000fff00000 0000000000100000 Reserved
Anyhow, I hope this example shows how to do BIOS interrupts using libx86 from userspace in Linux.
Thursday, 16 September 2010
Emitting faked keys from the PC AT keyboard
The PC keyboard controller can be accessed via I/O ports 0x60 and 0x64. The i8042 keyboard controller has the following registers:
* 8 bit input buffer, read-only, containing data read from the keyboard. Accessed by reading from port 0x60.
* 8 bit output buffer, write-only, for data to be written to the keyboard. Accessed by writing to port 0x60.
* 8 bit status register, read-only, accessed by reading port 0x64.
* 8 bit control register, read/write, accessed by using the "read commands byte" and "write command byte" commands.
A write to port 0x64 sends a command to the i8042 and if the command requires a parameter this parameter is must be written to port 0x60. If the command returns a result then it appears by reading port 0x60.
Keyboard controller command 0xD2 (Write Keyboard Buffer) is fairly interesting - this places values on the keyboard controller output port, making the operating system believe a keyboard key scan code has appeared. This allows us to force key scan codes into the controller to fake keys, by doing the following:
1. Wait for the Input Buffer Full bit (bit 1) of the status register (port 0x64) is clear
2. Write command 0xd2 to the control register (port 0x64)
3. Write the scan code into the data register (port 0x60)
To write a letter 'h', one writes the scan code 0x23 ('h' key down), waits a little while and then writes the scan scan code with the top bit set 0xa3 ('h' key up).
Some example code take fakes the "hello world" keys by this method can be found here.
Adam Chapweske has written an excellent in-depth description of how the AT and PS/2 keyboard controllers work without which I would not have found this useful nugget.
Wednesday, 15 September 2010
What I do
Fixing things is in my DNA - it's one of those passions that keeps me motivated and busy. Maybe it is the hunt - tracking down why something does not work that I find interesting, like a detective gathering evidence and then making a deduction that solves the mystery. Or maybe it is the fun in discovering or learning new features about a technology as I try to solve a bug. Or it could be the warm feeling in knowing that a problem is fixed which helps users to have a less buggy machine. Whatever the underlying reason, I get a kick out of fixing obscure problems and making things work better.
Fortunately for me, my work in Canonical enabling Ubuntu to work on PCs fulfils this passion of mine. My daily work normally involves me looking at obscure firmware issues in PC BIOSs and figuring out what is wrong and how to address and fix the problem.
Without fixing these issues, quite a few machines would just not function correctly for various reasons. My work involves fixing issues such as Suspend/Resume and Hibernate/Resume hangs, or looking at why hardware is not quite configured correctly after boot or resume. Unfortunately buggy firmware does happen quite frequently and leads to all sorts of weird issues. Hotkeys, LCD backlights, wake alarms, fan controls, thermal trip points and even CPU configuration can be affected by BIOS or ACPI bugs. All these need fixing, so it keeps me busy!
Fun in the deep endFirmware is unlike Open Source code found in Ubuntu - firmware is closed, proprietary and hence figuring out why it's broken can be tricky and hence time consuming.
I spend quite a lot time looking at kernel logs, ACPI tables and disassembling ACPI byte code looking at why kernel/BIOS interactions are misbehaving. Some of the work involves looking at the way the BIOS interacts with the embedded controller and figuring out if the ACPI byte code is written correctly or not.
Because Canonical has a good relationship with many desktop hardware vendors, I have access to the BIOS engineers who are actually writing this code. I can directly report my findings and suggested fixes to them, and then they re-work the BIOS. The end result is a PC that is sold with a BIOS that works correctly with Linux, and not just Ubuntu - all distributions benefit from this work.
You may not see my fixes appear as commits in the Linux kernel because much of my work is silent and behind the scenes - fixing firmware that make Linux work better.
Quality CountsMy other passion is quality. While it's fine to fix bugs, it's even better to detect them in the first place! Hence I was motivated to write the Firmware Test Suite - this is a tool that aims to find and diagnose BIOS and ACPI bugs automatically and even suggest possible workarounds and fixes. This tool is now being actively used by BIOS vendors to catch errors early in the development cycle and is part of the on going work to make sure that Linux compatibility really matters.
I've been developing this tool for the Maverick 10.10 release and hope to add more intelligent firmware tests for Natty 11.04 based on further analysis of current bug reports and lessons learnt while enabling Ubuntu on various PC hardware platforms.
I hope this gives a flavour of the kind of work I do for Ubuntu. It's enjoyable, challenging and satisfying to see one's work make Linux better.
Tuesday, 14 September 2010
Sensors reporting hot CPU in Maverick
My clunky old Lenovo has and Intel(R) Core(TM) Duo CPU (model 15) which coretemp in Lucid 10.04 assumed TjMax was 85 degrees C but now in Maverick 10.10 believes TjMax is 100 degrees C.
Kernel commit a321cedb12904114e2ba5041a3673ca24deb09c9 attempts to get TjMax from msr 0x1a2. If it fails to read this msr it defaults TjMax to 100 degrees C for CPU models 14, 15, 22 and 26, and one will see the following warning message:
[ 9.650025] coretemp coretemp.0: TjMax is assumed as 100 C!
[ 9.650322] coretemp coretemp.1: TjMax is assumed as 100 C!
For CPU models 23 and 28 (Atoms) TjMax will be 90 or 100 depending if it's a nettop or a netbook. Otherwise the patch will default TjMax to 100 degrees C.
One can check the value of TjMax using:
cat devices/platform/coretemp*/temp1_crit
Coretemp calculates the core temperature of the CPU by subtracting the thermal status from TjMax. Since the default has been increased from 85 to 100 degrees between Lucid and Maverick, the apparent core temperature now reads 15 degrees higher.
Now, if my machine really was running 15 degrees hotter between Lucid and Maverick I would see more power consumption. I checked the power consumption for Lucid and Maverick kernels on my Lenovo in idle and fully loaded CPU states with a power meter and observed that Maverick uses less power, so that's encouraging.
As for the correct value, why did the default change? Well, from what I can understand from several forums that discuss the setting of TjMax is that this is not well documented and not disclosed by Intel, hence the values are rule-of-thumb guesswork.
So, the bottom line is that if your CPU appears to run hot from the core temp readings between Lucid 10.04 and Maverick 10.10 first check to see if TjMax has changed on your hardware.
Monday, 13 September 2010
Hacking a custom DSDT into a QEMU BIOS
Today I was trying to reproduce a bunch of weird ACPI errors when executing AML code from a DSDT extracted from a remote machine. For some reason the AML in the 2.6.32 kernel was causing a bunch of warnings, but not in 2.6.35 and I wanted to see when the fix landed. This was a dirty hack so that I could quickly do kernel bisects running the kernel inside QEMU.
Firstly, I got the DSDT from the remote machine and converted into it form that could be included into the seabios BIOS images. I used the following C source:
gcc -Wall hexdump.c -o hexdump
Next I generated a C compilable hex dump of the DSDT.dat raw image:
./hexdump < DSDT.dat > acpi-dsdt.hex
Then I got the seabios sources:
git clone git://git.linuxtogo.org/home/kevin/seabios.git
and the copied the acpi-dsdt.hex to seabios/src
..and then cd into seabios and built using make. This creates bios.bin in the directory called out.
Then I copied the current QEMU bios, vgabios and seabios images to my working directory:
cp -R /usr/share/qemu /usr/share/vgabios /usr/share/seabios/ .
and then copied the compiled seabios image into the newly copied seabios directory:
cp seabios/out/bios.bin seabios
Finally, I ran QEMU using new BIOS image as follows:
qemu -L qemu ubuntu.img
Bit of a hack, but it helped when I did not have the hardware to hand.
Firstly, I got the DSDT from the remote machine and converted into it form that could be included into the seabios BIOS images. I used the following C source:
And built it with:
#include <stdio.h>
#include <stdlib.h>

int main(int argc, char **argv)
{
int data;
int i = 0;

printf("unsigned char AmlCode[] = {");
for (i=0; (data = getchar()) != EOF; i++)
        printf("%s%s0x%2.2x", i>0 ? "," : "",
                (i & 7) ? "" : "\n\t", data);
printf("\n};\n");

exit(EXIT_SUCCESS);
}
gcc -Wall hexdump.c -o hexdump
Next I generated a C compilable hex dump of the DSDT.dat raw image:
./hexdump < DSDT.dat > acpi-dsdt.hex
Then I got the seabios sources:
git clone git://git.linuxtogo.org/home/kevin/seabios.git
and the copied the acpi-dsdt.hex to seabios/src
..and then cd into seabios and built using make. This creates bios.bin in the directory called out.
Then I copied the current QEMU bios, vgabios and seabios images to my working directory:
cp -R /usr/share/qemu /usr/share/vgabios /usr/share/seabios/ .
and then copied the compiled seabios image into the newly copied seabios directory:
cp seabios/out/bios.bin seabios
Finally, I ran QEMU using new BIOS image as follows:
qemu -L qemu ubuntu.img
Bit of a hack, but it helped when I did not have the hardware to hand.
Wednesday, 8 September 2010
Hot Laptop
My Lenovo 3000N200 laptop has been playing me up. When I've been fully loading the processor or driving video hard it's been shutting down because of overheating. I suspect periodic SMIs are detecting an overheated CPU and the BIOS just stops the machine to avoid it turning into toast.
Suspecting that the latest 2.6.35 Maverick kernel was the cause I booted with a 2.6.32 Lucid kernel and that didn't help, so it didn't look like an obvious kernel regression.
Well, perhaps it's getting old and cranky - it's nearly 3 years old. Perhaps the thermal paste between the CPU and the heatsink is not working like it should. Since it was most probably a hardware issue I downloaded the service manual and got out the tr usty screwdriver and opened it up. Lo and behold 5mm of dust had accumulated over the fan grill which wasn't going to help the poor machine offload all that heat out of the laptop case. I removed the fan, gave it a good clean and removed all the dust from the fan outlet grill.
After reassembly the laptop was good as new. Instead of rebooting at 95+ degrees Celsius the Lenovo now runs happily.
The moral of the story is that I should regularly service the fans on my machines. Cooking the CPU is something I would like to avoid in the future.
Suspecting that the latest 2.6.35 Maverick kernel was the cause I booted with a 2.6.32 Lucid kernel and that didn't help, so it didn't look like an obvious kernel regression.
Well, perhaps it's getting old and cranky - it's nearly 3 years old. Perhaps the thermal paste between the CPU and the heatsink is not working like it should. Since it was most probably a hardware issue I downloaded the service manual and got out the tr
 usty screwdriver and opened it up. Lo and behold 5mm of dust had accumulated over the fan grill which wasn't going to help the poor machine offload all that heat out of the laptop case. I removed the fan, gave it a good clean and removed all the dust from the fan outlet grill.
After reassembly the laptop was good as new. Instead of rebooting at 95+ degrees Celsius the Lenovo now runs happily.
The moral of the story is that I should regularly service the fans on my machines. Cooking the CPU is something I would like to avoid in the future.
Monday, 6 September 2010
Digging into the BIOS CMOS Memory
The BIOS settings of a PC are stored in non-volatile memory (sometimes known as NVRAM) to ensure they are saved when the machine is off. On a PC, this NVRAM is CMOS (Complimentary Metal Oxide Semiconductor) memory and is trickle charged by a small battery to ensure the data is preserved. CMOS memory requires very little power hence it can be kept non-volatile by a battery for several years.
One can access the CMOS memory via ports 0x70 and 0x71. One writes the address of the CMOS memory location you want to read to port 0x70 and then read the contents via a read of port 0x70. I implemented this as follows:
Then it is a case of reading 128 bytes or so of CMOS memory using this function. The next step is decoding this raw data. Web-pages such as http://www.bioscentral.com/misc/cmosmap.htm contain CMOS memory maps, but it does tend to vary from machine to machine. With data from several memory map descriptions that I found on the Web I have figured out some common across different BIOS implementations and written some code to annotate the contents of the CMOS memory. There are a bunch of fields that need a little more decoding, but that's work in progress...
My aim is to add this into the Firmware Test Suite for 11.04 as part of a diagnostic feature.
One can access the CMOS memory via ports 0x70 and 0x71. One writes the address of the CMOS memory location you want to read to port 0x70 and then read the contents via a read of port 0x70. I implemented this as follows:
..I was not 100% sure of a small port delay was required between the write to port 0x70 and the read of data on port 0x71, but I added one in by writing to port 0x80 just in case. The ioperm() calls are required to get access to the I/O ports, and one needs to run this code with root privileges otherwise you will get a segmentation fault.
unsigned char cmos_read(int offset)
{
     unsigned char value;

     ioperm(0x70, 0x2, 1);
     ioperm(0x80, 0x1, 1);

     outb(offset, 0x70);
     outb(0, 0x80);  /* Small delay */
     value = inb(0x71);

     ioperm(0x80, 0x1, 0);
     ioperm(0x70, 0x2, 0);

     return value;
}
Then it is a case of reading 128 bytes or so of CMOS memory using this function. The next step is decoding this raw data. Web-pages such as http://www.bioscentral.com/misc/cmosmap.htm contain CMOS memory maps, but it does tend to vary from machine to machine. With data from several memory map descriptions that I found on the Web I have figured out some common across different BIOS implementations and written some code to annotate the contents of the CMOS memory. There are a bunch of fields that need a little more decoding, but that's work in progress...
My aim is to add this into the Firmware Test Suite for 11.04 as part of a diagnostic feature.
Friday, 3 September 2010
Embedded Linux Conference, April 2010 Videos
I had the privilege to attend the Embedded Linux Conference in San Francisco in April this year. Like all conferences with multiple tracks it's impossible to attend all the talks, fortunately Free Electrons are hosting the slides and videos of a lot of the talks, so one can catch up on all the goodness at http://free-electrons.com/blog/elc-2010-videos/. Enjoy!
Monday, 30 August 2010
Looking at a PC's option ROMs
An Option ROM is firmware called by the BIOS, for example the Video BIOS or a SCSI controller card. The BIOS Boot Specification requires that option ROMs are aligned to 2K boundaries and must begin with bytes 0x55 0xaa. After Power On Self Test (POST) the BIOS scans for option ROMs and if it finds a correct header executes the initialisation code at byte offset 0x3.
The Option ROM header is as follows:
Byte 0: 0x55
Byte 1: 0xaa
Byte 2: size of ROM in 512 byte pages
Byte 3: Option ROM entry point
To dump out the option ROMs, use the ree utility:
sudo apt-get install ree
..and run as follows:
sudo ree
..this will dump out all the option ROMs in the form: hexaddress.rom where hexaddress is the memory segment where the ROM is located. e.g. for my Video BIOS ROM, I get the file c0000.rom.
To disassemble this use ndisasm:
sudo apt-get install nasm
ndisasm -k 0,3 c0000.rom | less
..or just use strings on the ROM image to get an idea what the Option ROM is, e.g.
strings c0000.rom
000000000000
00IBM VGA Compatible BIOS.
PCIR
(00`
*@0p
H?@0b
..
..in this case it is a VGA BIOS, and this makes sense as VGA BIOS ROMs normally start from segment c0000. On my Lenovo laptop I observe that the ROM contains the string "DECOMPILATION OR DISASSEMBLY PROHIBITED" which spoils our fun in finding out what the ROM is doing...
Anyhow, ree + ndisasm are useful tools for poking around your PCs option ROMs on Linux.
Wednesday, 11 August 2010
loop devices, device mapper and kpartx
Recently I copied a hard disk image onto a backup drive using dd and later on needed to mount the third partition from this image. Usually I figure out the partition offset and mount using mount -oloop,offset=xxxx but I just could not be bothered this time around to figure out the offsets especially as I have several partitions in the image. Instead, I used the following runes:
1. Associate a loop device with the drive image:
losetup --show --find image-of-drive.img
..the --show option prints out the name of the loop device being used. In my case it was /dev/loop0
2. Create a device mapper device associated with the loop device:
echo "0 `blockdev --getsize /dev/loop0` linear /dev/loop0 0" | dmsetup create sdX
..this will create /dev/mapper/sdX
3. Use kpartx to create device maps from the partition tables on the mapper device:
kpartx -a /dev/mapper/sdX
4. And lo and behold this creates device maps over the detected partition segments. You can then mount the partitions as usual, e.g. partition #3:
mount /dev/mapper/sdX3 /mnt
..I should really put this now into a bash script for next time I need this...
Monday, 9 August 2010
Firmware Test Suite: BIOS+ACPI health check
 The FirmWare Test Suite (fwts) is a tool I've been working on to do automatic testing of a PC's firmware. There can be a lot of subtle or vexing Linux Kernel/firmware issues caused when firmware is buggy, so it's useful to have a tool that can automatically check for common BIOS and ACPI errors. Where possible the tool will give some form of advice on how to fix issues or workaround firmware issues.
It's packaged up and in Maverick universe, you can install it using:
sudo apt-get install fwts
To see the tests available in the tool use:
fwts --show-tests
There are over 30 tests and I hope to expand this every time I find new firmware issues which can be diagnosed automatically in a tool.
To run a test use, for example the ACPI AML syntax checking test use:
sudo fwts syntaxcheck
There are categories of tests, for example, by default fwts will run batch mode tests which run without the need of user intervention. Some tests, such as checking the laptop lid works or hotkeys requires user intervention - these are interactive tests and can be invoked using:
sudo fwts --interactive
By default the tool will append the test results into a log file called results.log. This logs the date/time the test was run, the name of the test and the test results and hopefully some useful advice if a test fails.
I suggest checking out the manual page to see some examples how to fully drive this tool.
Quite a lot of the tests have been picked up from the core of linuxfirmwarekit.org, but I've added a bunch more tests, and expanded the types of errors it checks for and the feedback advice it reports. I've targeted fwts to run with the Maverick 2.6.35 kernel but it should work fine on Lucid kernels too. I've written fwts with command line driven test framework to run the tests mainly to allow fwts to easily plug into more powerful test frameworks.
If you want to run the tool from a bootable USB flash key, then one can download a i386 or amd64 image and dd it to a USB flash key.
For example:
wget http://kernel.ubuntu.com/~kernel-ppa/testing/maverick-desktop-i386-fwts.img
sudo dd if=maverick-desktop-i386-fwts.img of=/dev/sdX
where /dev/sdX is the block device of your USB flash key
then boot off this USB flash key and let it run the tests. At the end it will automatically shutdown the PC and you can then remove the key. The key has a FAT formatted partition containing the results of the test in a directory named: fwts/ddmmyyyy/hhmm/results.log, where ddmmyyyy are the digits in the date and hhmm for the time the test was started.
The fwts PPA can be found in the Firmware Testing Team project and the source code is available in a git repository here.
I've also written a short OpenOffice presentation on the tool which also may prove instructive.
Tuesday, 27 July 2010
Multiple ISO Boot USB Key
Last week my colleague Ike Pan showed the Ubuntu Kernel Team how to create a bootable USB key with multiple ISO images on it. One simply copies ISO images to the USB key and these can be booted using grub's loopback support.
Thanks to Andy Whitcroft for helpfully writing up the step-by-step instructions.
Thanks to Andy Whitcroft for helpfully writing up the step-by-step instructions.
Wednesday, 21 July 2010
GPEs, Embedded Contoller and ACPI
I was poking around with a laptop lid problem a week ago and thought it would be helpful to document the way GPEs work with the Embedded controller and ACPI. An OpenOffice presentation can be found here.
Monday, 21 June 2010
The Git Community Book
The Git Community Book (maintained by Scott Chacon) is an excellent resource to help one learn how to use the Git version control system quickly and with minimal pain. The book includes a Git introduction, First Time use instructions, Basic Usage tutorial through to Advanced Git usage and also describes the internals and plumbing of Git too.
The book is available as browsable web pages or as a PDF too. Most excellent!
The book is available as browsable web pages or as a PDF too. Most excellent!
Wednesday, 16 June 2010
Figuring Out SATA SErr codes
Today I had to cast my eye over a SATA error message:
So how does one interpret the cryptic SErr magic? Pages 269-270 of the SATA ATA spec serialata10a.zip explains the SError register fields in fine detail.
Well, "SErr 0xd0000" relates to the SError bits 16, 18 and 19 which are the SERR_PHYRDY_CHG, SERR_COMM_WAKE and SERR_10B_8B_ERR bits as defined in include/linux/ata.h. The kernel decodes these and dumps out the error state in the "ata1: SError: { PHYRdyChg CommWake 10B8B }" line above - so that's helpful.
Anyhow, the spec describes these error codes in the DIAG field (page 270) - they are the top 16 bits of the SError register. Armed with the spec one can then decode these error bits. It's not rocket science, one just needs to know where to look this information up.
ata1: exception Emask 0x10 SAct 0x0 SErr 0xd0000 action 0xe frozen
ata1: irq_stat 0x00400000, PHY RDY changed
ata1: SError: { PHYRdyChg CommWake 10B8B }
ata1: hard resetting link
So how does one interpret the cryptic SErr magic? Pages 269-270 of the SATA ATA spec serialata10a.zip explains the SError register fields in fine detail.
Well, "SErr 0xd0000" relates to the SError bits 16, 18 and 19 which are the SERR_PHYRDY_CHG, SERR_COMM_WAKE and SERR_10B_8B_ERR bits as defined in include/linux/ata.h. The kernel decodes these and dumps out the error state in the "ata1: SError: { PHYRdyChg CommWake 10B8B }" line above - so that's helpful.
Anyhow, the spec describes these error codes in the DIAG field (page 270) - they are the top 16 bits of the SError register. Armed with the spec one can then decode these error bits. It's not rocket science, one just needs to know where to look this information up.
Saturday, 29 May 2010
Poking around the HD-Audio Configuration
HD-Audio can be reconfigured without having to re-load the driver using the special sysfs files - this enables one to twiddle and debug HD-audio in a relatively pain free way.
Each codec-hwdep device has a sysfs directory in /sys/class/sound populated with a bunch of files which can be read. Some of these files can be written to, enabling one to over-ride the default. For example on my Lenovo I have /sys/class/sound/hwC0D0 which contains:
vendor_id
32 bit codec vendor id (hex) (read-write)
subsystem_id
32 bit subsystem id (hex) (read-write)
revision_id
32 bit revision id (hex) (read-write)
chip_name
name of chipset
afg
AFG id (read-only)
mfg
MFG id (read-only)
name
code name string (read-write)
modelname
current model option (read-write)
init_verbs
verbs to be execute at initialisation time. Extra verbs can be added by writing to init_verbs as numbers in the form: nid verb parameter
hints
hint strings in format 'key= value', e.g. eapd_switch = yes (for example, this particular hint is picked up by a call to snd_hda_get_bool_hint(codec, "eapd_switch") in the patch_sigmatel.c source)
init_pin_configs
show the default initial pin configurations as set up by the BIOS at boot time
driver_pin_configs
show the default pin configurations as set by the codec parser. Only pin configurations changed by the parser are shown.
user_pin_configs
show ping configurations used to override the BIOS set up configurations. One can append new values by writing a nid and value tuple to this file.
reconfig
triggers codec reconfiguration by writing any value to this file
clear
codec reset, remove mixer elements, clear all init verbs and hints
For example to see the BIOS pin configurations on my Lenovo laptop:
$ cat /sys/class/sound/hwC0D0/init_pin_configs
0x14 0x99130110
0x15 0x411111f0
0x16 0x411111f0
0x17 0x411111f0
0x18 0x03a19820
0x19 0x99a3012f
0x1a 0x411111f0
0x1b 0x0321401f
0x1c 0x411111f0
0x1d 0x40178e2d
0x1e 0x411111f0
And to identify my audio hardware, I can use:
..showing that my Lenovo has Realtek ALC861-VD and the vendor and subsystem ids.
Enjoy!
Each codec-hwdep device has a sysfs directory in /sys/class/sound populated with a bunch of files which can be read. Some of these files can be written to, enabling one to over-ride the default. For example on my Lenovo I have /sys/class/sound/hwC0D0 which contains:
vendor_id
32 bit codec vendor id (hex) (read-write)
subsystem_id
32 bit subsystem id (hex) (read-write)
revision_id
32 bit revision id (hex) (read-write)
chip_name
name of chipset
afg
AFG id (read-only)
mfg
MFG id (read-only)
name
code name string (read-write)
modelname
current model option (read-write)
init_verbs
verbs to be execute at initialisation time. Extra verbs can be added by writing to init_verbs as numbers in the form: nid verb parameter
hints
hint strings in format 'key= value', e.g. eapd_switch = yes (for example, this particular hint is picked up by a call to snd_hda_get_bool_hint(codec, "eapd_switch") in the patch_sigmatel.c source)
init_pin_configs
show the default initial pin configurations as set up by the BIOS at boot time
driver_pin_configs
show the default pin configurations as set by the codec parser. Only pin configurations changed by the parser are shown.
user_pin_configs
show ping configurations used to override the BIOS set up configurations. One can append new values by writing a nid and value tuple to this file.
reconfig
triggers codec reconfiguration by writing any value to this file
clear
codec reset, remove mixer elements, clear all init verbs and hints
For example to see the BIOS pin configurations on my Lenovo laptop:
$ cat /sys/class/sound/hwC0D0/init_pin_configs
0x14 0x99130110
0x15 0x411111f0
0x16 0x411111f0
0x17 0x411111f0
0x18 0x03a19820
0x19 0x99a3012f
0x1a 0x411111f0
0x1b 0x0321401f
0x1c 0x411111f0
0x1d 0x40178e2d
0x1e 0x411111f0
And to identify my audio hardware, I can use:
$ cat /sys/class/sound/hwC0D0/ \
{vendor_name,chip_name,vendor_id,subsystem_id}
Realtek
ALC861-VD
0x10ec0862
0x17aa3867
{vendor_name,chip_name,vendor_id,subsystem_id}
Realtek
ALC861-VD
0x10ec0862
0x17aa3867
..showing that my Lenovo has Realtek ALC861-VD and the vendor and subsystem ids.
Enjoy!
Thursday, 27 May 2010
How Linux suspend and resume works in the ACPI age
Matthew Garrett wrote a particularly insightful explanation of how suspend/resume works in this article at Advogato. It makes an interesting read to see exactly what is going on and why things go wrong!
Thursday, 29 April 2010
HDA Analyzer
The HDA Analyzer tool that allows one to look at the raw HD-audio control data in an easy to user GUI. The instructions on how to download and use this tool are described at the HDA Analyzer page - they are as follows:
1. Fetch:
2. Run:
python run.py
And browse...

This certainly takes the pain out of looking at the control information.
1. Fetch:
wget -O run.py http://www.alsa-project.org/hda-analyzer.py
2. Run:
python run.py
And browse...

This certainly takes the pain out of looking at the control information.
Thursday, 8 April 2010
Saving power on my HPMini (revisited on Lucid)
A while ago I blogged about power saving on my HPMini. Well, today I'm revisiting this using today's Lucid daily and I'm pleased to see that I can save a small amount of power with Lucid compared to Karmic. However, the difference is small - the inaccuracies of estimating power consumption using ACPI may be more significant.
My steps were as follows:
0. Run powertop for about 15 minutes on battery power and note down the recommended power saving tricks.
1. Blacklist Bluetooth, since I don't use this and it really sucks a load of power. To do so, add the following to /etc/modprobe.d/blacklist.conf
2. Enable HDA audio powersaving:
3. Increase dirty page writeback time:
4. Disable the webcam driver (not sure exactly if this saves much power), add the following to /etc/modprobe.d/blacklist.conf
5. Turn down the screen brightness (this saves 0.3 Watts)
6. Disable desktop effects to save some power used by compositing.
7. Disable cursor blinking on the gnome terminal to save 2 wakeups a second, using:
I managed to push the power consumption down to ~6.5 Watts which is an improvement of nearly 1 Watt from my tests on Karmic. Not bad, but I don't fully trust the data from the battery/ACPI and I really need to see how much extra battery life these tweaks give me when I'm using the machine on my travels.
On an idle machine I'm seeing > ~99.0% C4 residency, which is quite acceptable. Running powertop is always leads to insights to saving power, so kudos to Intel for this wonderful utility.
My steps were as follows:
0. Run powertop for about 15 minutes on battery power and note down the recommended power saving tricks.
1. Blacklist Bluetooth, since I don't use this and it really sucks a load of power. To do so, add the following to /etc/modprobe.d/blacklist.conf
blacklist btusb
2. Enable HDA audio powersaving:
echo 1 > /sys/module/snd_hda_intel/parameters/power_save
3. Increase dirty page writeback time:
echo 1500 > /proc/sys/vm/dirty_writeback_centisecs
4. Disable the webcam driver (not sure exactly if this saves much power), add the following to /etc/modprobe.d/blacklist.conf
blacklist uvcvideo
5. Turn down the screen brightness (this saves 0.3 Watts)
6. Disable desktop effects to save some power used by compositing.
7. Disable cursor blinking on the gnome terminal to save 2 wakeups a second, using:
gconftool-2 --type string --set /apps/gnome-terminal/profiles/Default/cursor_blink_mode off
I managed to push the power consumption down to ~6.5 Watts which is an improvement of nearly 1 Watt from my tests on Karmic. Not bad, but I don't fully trust the data from the battery/ACPI and I really need to see how much extra battery life these tweaks give me when I'm using the machine on my travels.
On an idle machine I'm seeing > ~99.0% C4 residency, which is quite acceptable. Running powertop is always leads to insights to saving power, so kudos to Intel for this wonderful utility.
Friday, 26 March 2010
Installing Intel Microcode Updates
It is not unknown for personal computers to be shipped with subtle and rarely occurring bugs in the x86 processor. Normally these bugs can be fixed with microcode updates that get loaded by the BIOS at boot time. However, re-flashing a BIOS may be deemed to risky (since it can brick a machine) or perhaps one can no longer get BIOS updates to an older machine.
This is where the Intel microcode updates come in useful. To install these on Ubuntu use:
sudo apt-get install intel-microcode
These may then fix subtle bugs, so it's always worth a try when you see strange processor related issues such inexplicable memory related oopses.
The caveat is that the microcode is loaded late in boot time, so you may not be able to workaround bugs in the early boot phase. For example, when coming out of hibernate you may hit a processor related bug that's fixed with the microcode update - however, the microcode is loaded late into the resume from hibernate phase, so it cannot be fixed this way.
Sunday, 21 March 2010
Debugging ACPI using acpiexec
The acpiexec tool is an AML emulator that allows one to execute and interactively ACPI AML code from your BIOS. The tarball can be downloaded from the ACPICA website and built as follows:
1. Unzip and untar the acica-unix-20100304.tar.gz tarball.
2. cd into tools/acpiexec
3. run make
This should build acpiexec. Now for the fun part - executing your ACPI inside the emulator. To do this grab your ACPI tables and extract them using:
Now load these tables into the emulator and run with verbose mode:
Inside the emulator you can type help to navigate around the help system. It may take a little bit of work to get familiar with all the commands available.
As a quick introduction, here is how to execute the battery information _BIF method.
1. Get a list of all the available methods, type:
on my Lenovo laptop the battery information method is labelled \_SB_.PCI0.LPCB.BAT1._BIF, so to execute this method I use:
So far so good. I single stepped through the code using the debug command on the method as follows:
at each % prompt, one can press enter to step the next instruction. If the method requires arguments, these can be passed into the method by specifying them after the method name from the debug command.
To see any local variables used during execution, use the locals command. The list command lists the current AML instructions. The set commands allows one to set method data and interact with the debugging processes.
Hopefully this gives one a taste of what the emulator can do. The internal help is enough to get one up and running, and one does generally require the current ACPI specification to figure out what's happening in your ACPI tables.
1. Unzip and untar the acica-unix-20100304.tar.gz tarball.
2. cd into tools/acpiexec
3. run make
This should build acpiexec. Now for the fun part - executing your ACPI inside the emulator. To do this grab your ACPI tables and extract them using:
sudo acpidump > acpi.info && acpixtract -a acpi.info
Now load these tables into the emulator and run with verbose mode:
./acpiexec -v *.dat
Inside the emulator you can type help to navigate around the help system. It may take a little bit of work to get familiar with all the commands available.
As a quick introduction, here is how to execute the battery information _BIF method.
1. Get a list of all the available methods, type:
methods
on my Lenovo laptop the battery information method is labelled \_SB_.PCI0.LPCB.BAT1._BIF, so to execute this method I use:
execute \_SB_.PCI0.LPCB.BAT1._BIF
Executing \_SB_.PCI0.LPCB.BAT1._BIF
Execution of \_SB_.PCI0.LPCB.BAT1._BIF returned object 0x19669d0 Buflen 178
[Package] Contains 13 Elements:
[Integer] = 0000000000000001
[Integer] = 0000000000000FA0
[Integer] = 0000000000000FA0
[Integer] = 0000000000000001
[Integer] = 0000000000002B5C
[Integer] = 00000000000001A4
[Integer] = 000000000000009C
[Integer] = 0000000000000108
[Integer] = 0000000000000EC4
[String] Length 08 = PA3465U
[String] Length 05 = 3658Q
[String] Length 06 = Li-Ion
[String] Length 07 = COMPAL
So far so good. I single stepped through the code using the debug command on the method as follows:
debug \_SB_.PCI0.LPCB.BAT1._BIF
at each % prompt, one can press enter to step the next instruction. If the method requires arguments, these can be passed into the method by specifying them after the method name from the debug command.
To see any local variables used during execution, use the locals command. The list command lists the current AML instructions. The set commands allows one to set method data and interact with the debugging processes.
Hopefully this gives one a taste of what the emulator can do. The internal help is enough to get one up and running, and one does generally require the current ACPI specification to figure out what's happening in your ACPI tables.
Perf tool now in Ubuntu Lucid.
A few months ago I blogged about the perf tool and how useful it is to drill down into kernel and user space applications to analyse performance bottle necks. Well, thanks to Andy Whitcroft, the perf tool is now available in Ubuntu Lucid. Perf needs to be in lock-step with the kernel, which complicated the packaging of this tool.
To install, use:
and this installs the perf, perf-stat, perf-top, perf-record, perf-report and perf-list tools.
The author of perf, Ingo Molnar has written some basic instructions on driving perf in the tools/perf/Documentation/example.txt file. They should give one a feel of how to drive these tools.
For example, to examine google-chrome:
... run a test and then exit, and then generate a summary of activity:
One can examine specific events in the system too. To get a list of available events use:
For example, to measure CPU cycles, number of instructions, context switches and kmallocs on google-chrome one uses:
perf stat -e cpu-cycles -e instructions -e context-switches -e kmem:kmalloc google-chrome
Performance counter stats for 'google-chrome':
15576472832 cycles # 0.000 M/sec
13466330277 instructions # 0.865 IPC
40791 context-switches # 0.000 M/sec
38602 kmem:kmalloc # 0.000 M/sec
18.062301718 seconds time elapsed
One more quick example, this time we record a call-graph (stack chain/backtrace) of the dd command:
perf record -g dd if=/dev/zero of=/dev/null bs=1M count=4096
and get the call graph using:
# Samples: 12584 # # Overhead Command Shared Object Symbol # ........ ............... ............................... ...... # 95.96% dd [kernel] [k] __clear_user | |--99.69%-- read_zero | vfs_read | sys_read | system_call_fastpath | __read --0.31%-- [...]
1.37% dd [kernel] [k] read_zero 0.87% dd [kernel] [k] _cond_resched | |--50.91%-- read_zero | vfs_read | sys_read | system_call_fastpath | __read
..etc.
I recommend reading Ingo's example.txt and playing around with this tool. It is very powerful and allows one to drill down and examine system performance right down to the instruction level.
To install, use:
sudo apt-get install linux-tools
and this installs the perf, perf-stat, perf-top, perf-record, perf-report and perf-list tools.
The author of perf, Ingo Molnar has written some basic instructions on driving perf in the tools/perf/Documentation/example.txt file. They should give one a feel of how to drive these tools.
For example, to examine google-chrome:
perf record google-chrome
... run a test and then exit, and then generate a summary of activity:
perf report
perf list
For example, to measure CPU cycles, number of instructions, context switches and kmallocs on google-chrome one uses:
perf stat -e cpu-cycles -e instructions -e context-switches -e kmem:kmalloc google-chrome
Performance counter stats for 'google-chrome':
15576472832 cycles # 0.000 M/sec
13466330277 instructions # 0.865 IPC
40791 context-switches # 0.000 M/sec
38602 kmem:kmalloc # 0.000 M/sec
18.062301718 seconds time elapsed
One more quick example, this time we record a call-graph (stack chain/backtrace) of the dd command:
perf record -g dd if=/dev/zero of=/dev/null bs=1M count=4096
and get the call graph using:
# Samples: 12584 # # Overhead Command Shared Object Symbol # ........ ............... ............................... ...... # 95.96% dd [kernel] [k] __clear_user | |--99.69%-- read_zero | vfs_read | sys_read | system_call_fastpath | __read --0.31%-- [...]
1.37% dd [kernel] [k] read_zero 0.87% dd [kernel] [k] _cond_resched | |--50.91%-- read_zero | vfs_read | sys_read | system_call_fastpath | __read
..etc.
I recommend reading Ingo's example.txt and playing around with this tool. It is very powerful and allows one to drill down and examine system performance right down to the instruction level.
Friday, 19 March 2010
Reading the TSC from userspace
Recently I've been poking around looking at some Time Stamp Counter (TSC) anomalies when coming out of suspend. So what is the TSC? It's a 64 bit high resolution tick counter found on X86 processors (since Pentiums) and can be read using the rdtsc instruction.
It is intended to be a fast method of getting a high resolution timer. However it is known to problematic on multi-core and hyperthreaded CPUs - one needs to be locked to one CPU to get reliable results since the TSC may be different on each CPU. It is also known to reset when coming out of resume which means time can look like it goes backwards in a huge jump.
If the CPU speed is changed then the TSC rate can change too. If you have a more recent Intel CPU where the constant_tsc flag is set (see /proc/cpuinfo) then the TSC will run at a constant rate no matter the CPU speed - but this means that benchmarking with the constant TSC may make programs look like they use more CPU cycles than in reality!
Anyhow, getting the 64 bit TSC value is a simple case of using the rdtsc instruction. I've got some example code to do this here with the necessary inlined assembler magic to handle this correctly for 32 and 64 bit builds.
Saturday, 6 March 2010
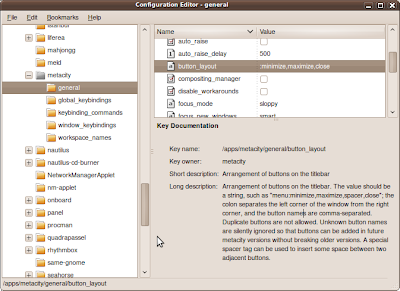
Tweaking the Gnome Window Button Layout
Call me old fashioned, but I kind of like my Gnome Window buttons to be on the right hand side of a Window, rather than on the left. Fortunately this can be easily configured using gconf-editor. Run gconf-editor and select: apps->metacity->general and then select the button_layout configuration setting and change it to:
:minimize,maximize,close
The leading colon sets the button icons on the right of a window and a trailing colon sets the button icons on the left of a window. Easy!
If you don't want to run the GUI tool, use the following rune:
gconftool-2 --type string --set /apps/metacity/general/button_layout :minimize,maximize,close
:minimize,maximize,close
The leading colon sets the button icons on the right of a window and a trailing colon sets the button icons on the left of a window. Easy!

If you don't want to run the GUI tool, use the following rune:
gconftool-2 --type string --set /apps/metacity/general/button_layout :minimize,maximize,close
Monday, 22 February 2010
Atom Z530 identity crisis
Last week I peeked at /proc/cpuinfo on a Atom Z530 netbook and got the following model name information:
model name : Intel(R) Core (TM) CPU Z530 @ 1.60GHz
Is the kernel mistaken? It's not a Core CPU, it's an Atom! In fact the Z530 is mistaken. If one examines page 29 of http://download.intel.com/design/processor/specupdt/319536.pdf you will see errata AAE29:
"AAE29 CPUID Instruction Returns Incorrect Brand String
When a CPUID instruction is executed with EAX = 80000002H, 80000003H and 80000004H on an Intel® Atom(TM) processor, the return value contains the brand string Intel(R) Core(TM)2 CPU when it should have Intel(R) Atom(TM) CPU."
Doh! That's a rather poor mistake in the silicon.
Apparently this affects Intel® Atom(TM) processors Z550, Z540, Z530, Z520, Z515, Z510, and Z500 on 45-nm process technology. It is fixable with a microcode fix, which normally involves getting a BIOS upgrade.
The errata makes interesting reading - especially errata AAE44 and AAE46 - for older kernels I suggest booting with kernel boot option mem=nopentium to work around any bizarre kernel oopses caused by these particular processor bugs. In fact, I recommend this for any Atom processor as these bugs seem to also apply to the Atom Nxxx series to.
Friday, 19 February 2010
Examining Wifi Signal Quality
If one looks at the Wifi signal quality reported by a variety of Linux laptops one will see a range of different results even though the machines are the same distance from an access point.
So why is this? Well, some of it has to do with the physical hardware - antennae, diversity, and the wifi silicon too. The other factor to consider is the Wifi driver, which may or may not calculate the signal quality as one would expect.
Bill Moss has written an excellent article describing the method used to calculate the ipw2200 wireless signal quality. It's based on a least squares fit on four data points from calibrations on the Windows XP driver. His article compares the traditional linear model based on the raw hardware provided Received Signal Strength Indicator (RSSI) values to the quadratic model used by the ipw2200 driver. It's an interesting read.
The problem is that the RSSI scale is vendor specific and maximum values vary (e.g. Ciscso uses 101, Atheros 60). RSSI is not associated with any power scale such as mW - it is an arbitrary scale which the hardware provides to a device driver. One should not assume that the values are precise or even very accurate either. There is more detail about this in this posting by Afsaneh Sattari. Hopefully you see the problem.
Looking at drivers in more detail, one finds the calculation varies from driver to driver:
For example Ath9K, Ath5K, Hostap, iwmc3200, rtl8187 and wl12xx drivers (to name but a few) use a linear mapping from the RSSI to calculate the signal quality. iwlwifi uses a least squares fit, rt2x00 uses a scaled down RSSI with a larger mix of TX/RX success and failure weightings. And libertas uses RSSI with a mix of TX success and failure weightings.
So next time you compare your Wifi signal quality on your laptop with somebody else bear in mind there are many factors to make up this meaningless indicator of quality metric!
Tuesday, 16 February 2010
GCC inline assembler explained
There are times when the Linux Kernel uses inline assembler to either use specific instruction sequences for optimal code efficiency or to use processor features that are not accessible in C (e.g. memory barriers, I/O instructions, manipulating processor state, etc..).
GCC provides a mechanism to enable one to place inlined assembler into C source but to the beginner the syntax can be a little impenetrable. A useful little primer and guide to GCC inline assembler can be found at http://www.ibiblio.org/gferg/ldp/GCC-Inline-Assembly-HOWTO.html
The primer is a little old, but nevertheless it is still valid and very useful.
Monday, 15 February 2010
Kernel Oops page fault error codes
The x86 Linux kernel Oops messages provide normally just enough information to help a kernel developer corner and fix critical bugs. The start of a typical Oops message may look like the following:
kernel BUG at kernel/signal.c:1599!
Unable to handle kernel NULL pointer dereference at virtual address 00000000
pc = 84427f6a
*pde = 00000000
Oops: 0001 [#1]
The 4 digit value after the "Oops:" message dumps out the page fault error code in hexadecimal which in turn can help one deduce what caused the oops. The page fault error code is encoded as follows:
bit 0 - 0 = no page found, 1 = protection fault
bit 1 - 0 = read access, 1 = write access
bit 2 - 0 = kernel-mode access, 1 = user mode access
bit 3 - 0 = n/a, 1 = use of reserved bit detected
bit 4 - 0 = n/a, 1 = fault was an instruction fetch
So, in the above example, the Oops error code was 0x0001 which means it was a page protection fault, read access in kernel mode.
A lot of Oops error codes are 0x0000, which means a page was not found by a read access in kernel mode.
For more information, consult arch/x86/mm/fault.c
Sunday, 14 February 2010
200 Mbps Powerline Ethernet Plugs
 This week I bought a pair of 200 Mbps powerline ethernet plugs from Faculty-X to add some extra home network connectivity. Up until now I've been happy with the speed of my 80211g Wifi network, but I really wanted to get a faster connection between two parts of my house and I didn't want to run any Ethernet cabling through my walls.
I purchased some budget powerline plugs which did state on the box they worked for Windows, Mac and Linux, but on receiving them found that one needed to run a Windows based configuration tool to configure a password protected private LAN connection between the two plugs. However, by default, one can just plug these devices into the electrical wall sockets and they work, but the network is public.
So I gritted my teeth and tried to run the configuration software from Wine, but I could not connect to the plugs. Then I tried from a virtual Windows Vista inside KVM and also failed to connect and configure the devices. Finally, I installed Vista on a sacrificial laptop, ran the configuration software and configured the two plugs to run as a private network. Amusingly I was able to scan and find some other powerline plugs with very week signals, so somebody else down my street is using similar kit.
The private network is protected using 128 bit AES encryption on the link, plus I only connect to machines using ssh, so hopefully it reduces the snooping risk.
My gripe is that a box should not be labelled "compatible with Windows, Mac and Linux" when in fact the configuration software in Windows based. This is totally misleading and disingenuous. To have to run a OS-centric app to get the full functionality of networking kit is very lame.
The pragmatic side of my personality chose to go the path of least resistance and configure the powerline plugs using Windows (with much gnashing of teeth). The hacker side of my personality wanted to capture the packet activity between the the configuration application and the powerline plug to help me write a open source configuration tool. When I get a spare 10 minutes I will write to the manufacturer and see if they will open up the configuration protocol...
As for speed - well, I'm fairly pleased. With the two devices plugged into a 4 way power socket I was able to get about 150Mbs+ and between two floors in my house across two ring mains (with fairly old wiring) I was able to get about 100Mbs which isn't bad considering all the noisy kit such as fridges that cause interference.
My upstairs network has been mainly wifi based - even my server runs off a Ralink wifi card. I mainly ssh into my server, so network performance has not really been an issue. However, as of this weekend, my server is now connected to the network via one of these powerline plugs I can now send a Wake-on-LAN (WoL) packet to the server to switch it on remotely. I just installed the wakeonlan package and then run the wakeonlan command specifying the MAC address of the server's Ethernet card - easy!
The next few months will see how reliable these devices are. The technical blurb with the plugs states that they only use 6W - when I get a spare half hour I will measure the power consumption of an idle and busy network to get an idea of the true yearly running cost.
Wednesday, 10 February 2010
x86 BIOS calls used by grub and Linux
The other day I was checking up to see which BIOS calls are used by grub and Linux. I naively believed grub used just a few to get some disk geometry information and to do some reads as well as a little bit of console/keyboard I/O. In fact Grub uses quite a few BIOS calls, namely:
BIOS "int 0x13 Function 0x41, bx=0x55aa" to check if LBA mode is
supported
BIOS "int 0x13 Function 0x42" read sectors from disk into memory (LBA
mode)
BIOS "int 0x13 Function 0x08" determine HDD geometry
BIOS "int 0x13 Function 0x02" read sectors from disk into memory
(non-LBA mode)
BIOS "int 0x13 Function 0x00" reset floppy drive (if not booted from
HDD)
BIOS "int 0x13 Function 0x4B01" check bootable CD-ROM emulation
status
BIOS "int 0x13 Function 0x4800" get driver paramaters
BIOS "int 0x15 Function 0xe801" get memory size (Phoenix BIOS v4.0)
BIOS "int 0x15 Function 0xe820" get memory map
BIOS "int 0x15 Function 0xc0" get ROM configuration
BIOS "int 0x15 Function 0x2400" disable A20 gate
BIOS "int 0x10 Function 0x4f00" get SVGA information (VBE)
BIOS "int 0x10 Function 0x4f01" get SVGA mode
BIOS "int 0x10 Function 0x4f02" set SVGA mode
BIOS "int 0x10 Function 0x01" set cursor shape
BIOS "int 0x10 Function 0x02" set cursor position
BIOS "int 0x10 Function 0x03" get cursor position and size
BIOS "int 0x10 Function 0x09" write character and attribute at cursor
BIOS "int 0x10 Function 0x0e" write character in teletype mode
BIOS "int 0x16 Function 0x00" keyboard - get keystroke
BIOS "int 0x16 Function 0x01" keyboard - check for keystroke
BIOS "int 0x1a Function 0x02" get real-time clock
BIOS Advanced Power Management (APM) calls: Grub will ignore APM if it does not detect it - it's not manditory to have APM for grub to work. So these are non required.
APM "int 0x15 Function 0x5300" check for APM
APM "int 0x15 Function 0x5301" connection real-mode interface
APM "int 0x15 Function 0x5304" disconnect interface
APM "int 0x15 Function 0x5307" set power state
APM "int 0x15 Function 0x530E" driver version
As for the Linux kernel, it also uses quite a range of BIOS calls, for example figuring out specific system settings and doing console work.
Below is a list of calls that I could find in the x86 arch specific code, I'm not sure if it's the fully definitive list, but I believe I found the majority of the BIOS calls.
BIOS "int 0x10 Function 0x00" set video mode
BIOS "int 0x10 Function 0x02" set cursor position
BIOS "int 0x10 Function 0x03" get cursor position and size
BIOS "int 0x10 Function 0x0e" write character in teletype mode
BIOS "int 0x10 Function 0x0f" get current video mode
BIOS "int 0x10 Function 0x0100" set cursor scan lines
BIOS "int 0x10 Function 0x1111" set 9x14 font
BIOS "int 0x10 Function 0x1112" set 8x8 font
BIOS "int 0x10 Function 0x1200" bl=0x10, check EGA/VGA
BIOS "int 0x10 Function 0x1200" bl=0x20, video, alternative function
select
BIOS "int 0x10 Function 0x1201" bl=0x34, turn of cursor emulation
BIOS "int 0x10 Function 0x1a00" get display combination code
BIOS "int 0x10 Function 0x4f00" get SVGA information (VBE)
BIOS "int 0x10 Function 0x4f01" get SVGA mode
BIOS "int 0x10 Function 0x4f02" set SVGA mode
BIOS "int 0x10 Function 0x4f08" get/sec DAC palette control
BIOS "int 0x10 Function 0x4f0a" get protected mode interface
BIOS "int 0x10 Function 0x4f15" check DDC capabilities
BIOS "int 0x15 Function 0x2401" enable A20 gate
APM "int 0x15 Function 0x5300" check for APM
APM "int 0x15 Function 0x5303" connect interface
APM "int 0x15 Function 0x5304" disconnect interface
BIOS "int 0x15 Function 0xe980" get Intel speedset information
BIOS "int 0x15 Function 0xec00" set BIOS CPU mode
BIOS "int 0x15 Function 0xc0" query MCA
BIOS "int 0x15 Function 0xe801" get memory size (Phoenix BIOS v4.0)
BIOS "int 0x15 Function 0xe820" get memory map
BIOS "int 0x15 Function 0x88" get extended memory size
BIOS "int 0x16 Function 0x00" keyboard - get keystroke
BIOS "int 0x16 Function 0x01" keyboard - check for keystroke
BIOS "int 0x16 Function 0x0305" set keyboard rate
BIOS "int 0x1a Function 0x02" get real time clock
BIOS "int 0x1a Function 0x02" get real time clock
Needless to say, some of these are not used for example, the use of some depend on how the console is configured.
Anyhow, it's quite surprising how much we still rely on core BIOS functionality to get a system up and running. Kudos to Ralph Brown's interrupt list to help me figure out the BIOS int and function code mappings.
Sunday, 7 February 2010
GCC hacks in the Linux Kernel
M. Tim Jones has written a concise and useful article on some useful special optimisation hints and capabilities found in version 4.3.2 of the GNU C Compiler.
The article describes how to use these methods and includes working examples found in Linux kernel. It will take just 5-10 minutes to read and is time worth spent to get up to speed with these useful GCC hacks
The article describes how to use these methods and includes working examples found in Linux kernel. It will take just 5-10 minutes to read and is time worth spent to get up to speed with these useful GCC hacks
Monday, 1 February 2010
inteltool - dumps Intel CPU/chipset configuration settings
A little used tool from the coreboot project is inteltool. This tool is useful for dumping the configuration space of Intel CPUs and for examining the Northbridge and Southbridge settings.
The debian package can be found in universe, and can be installed using:
..and has to be run using sudo.
At the simplest level, it can be run to get CPU and Northbridge/Southbridge version information:
$ sudo inteltool
Intel CPU: Family 6, Model f
Intel Northbridge: 8086:2a00 (PM965)
Intel Southbridge: 8086:2815 (ICH8-M)
However, one can drill down a bit, for example to get a dump of the GPIO settings, use the -g flag, e.g.:
$ sudo inteltool -g
Intel CPU: Family 6, Model f
Intel Northbridge: 8086:2a00 (PM965)
Intel Southbridge: 8086:2815 (ICH8-M)
============= GPIOS =============
GPIOBASE = 0x1180 (IO)
gpiobase+0x0000: 0x99541d02 (GPIO_USE_SEL)
gpiobase+0x0004: 0xe0fa7fc2 (GP_IO_SEL)
gpiobase+0x0008: 0x00000000 (RESERVED)
gpiobase+0x000c: 0xe1aa5fc7 (GP_LVL)
gpiobase+0x0010: 0x00000000 (GPIO_USE_SEL Override (LOW))
gpiobase+0x0014: 0x00000000 (RESERVED)
gpiobase+0x0018: 0x00000000 (GPO_BLINK)
gpiobase+0x001c: 0x00000000 (GP_SER_BLINK)
gpiobase+0x0020: 0x00080000 (GP_SB_CMDSTS)
gpiobase+0x0024: 0x00000000 (GP_SB_DATA)
gpiobase+0x0028: 0x00000000 (RESERVED)
gpiobase+0x002c: 0x00001900 (GPI_INV)
gpiobase+0x0030: 0x00000146 (GPIO_USE_SEL2)
gpiobase+0x0034: 0x00540f70 (GP_IO_SEL2)
gpiobase+0x0038: 0x00540f74 (GP_LVL2)
gpiobase+0x003c: 0x00000000 (GPIO_USE_SEL Override (HIGH))
There are other options to dump out the RCBA, Power Management, Memory Controller, EPBAR, DMIBAR and PCIEXBAR registers as well as the CPU MSRs.
It's an excellent utility for digging into the configuration of any Intel PC.
The debian package can be found in universe, and can be installed using:
sudo apt-get install inteltool
..and has to be run using sudo.
At the simplest level, it can be run to get CPU and Northbridge/Southbridge version information:
$ sudo inteltool
Intel CPU: Family 6, Model f
Intel Northbridge: 8086:2a00 (PM965)
Intel Southbridge: 8086:2815 (ICH8-M)
However, one can drill down a bit, for example to get a dump of the GPIO settings, use the -g flag, e.g.:
$ sudo inteltool -g
Intel CPU: Family 6, Model f
Intel Northbridge: 8086:2a00 (PM965)
Intel Southbridge: 8086:2815 (ICH8-M)
============= GPIOS =============
GPIOBASE = 0x1180 (IO)
gpiobase+0x0000: 0x99541d02 (GPIO_USE_SEL)
gpiobase+0x0004: 0xe0fa7fc2 (GP_IO_SEL)
gpiobase+0x0008: 0x00000000 (RESERVED)
gpiobase+0x000c: 0xe1aa5fc7 (GP_LVL)
gpiobase+0x0010: 0x00000000 (GPIO_USE_SEL Override (LOW))
gpiobase+0x0014: 0x00000000 (RESERVED)
gpiobase+0x0018: 0x00000000 (GPO_BLINK)
gpiobase+0x001c: 0x00000000 (GP_SER_BLINK)
gpiobase+0x0020: 0x00080000 (GP_SB_CMDSTS)
gpiobase+0x0024: 0x00000000 (GP_SB_DATA)
gpiobase+0x0028: 0x00000000 (RESERVED)
gpiobase+0x002c: 0x00001900 (GPI_INV)
gpiobase+0x0030: 0x00000146 (GPIO_USE_SEL2)
gpiobase+0x0034: 0x00540f70 (GP_IO_SEL2)
gpiobase+0x0038: 0x00540f74 (GP_LVL2)
gpiobase+0x003c: 0x00000000 (GPIO_USE_SEL Override (HIGH))
There are other options to dump out the RCBA, Power Management, Memory Controller, EPBAR, DMIBAR and PCIEXBAR registers as well as the CPU MSRs.
It's an excellent utility for digging into the configuration of any Intel PC.
Sunday, 31 January 2010
inotail - tail clone using inotify
I regularly use the tail command to look at the end of log files - generally I use the -f flag to follow (monitor and display) new entries that are appended to the log.
Tail will poll every second to see if the file size is changed and will act if data has been appended or the file has been truncated, and the poll interval is adjustable. However, polling a file is plain ugly, it causes extra wakeup events and if one wants very fast updates then polling is not a good solution.
Hence, a better tool to use is inotail when following a file. Inotail uses inotify to only wake up inotail when a file has been modified, deleted or moved - hence no polling is required. This also means inotail will output the changes to a file almost immediately - unlike tail which by default may wait almost a second before detecting a change.
To install inotail use:
..and use it the same was as tail.
UPDATE: Pete Graner has also informed me that the tailf command is also an inotify based tail -f like replacement too. Just goes to show there are many ways of doing the same thing...
Tail will poll every second to see if the file size is changed and will act if data has been appended or the file has been truncated, and the poll interval is adjustable. However, polling a file is plain ugly, it causes extra wakeup events and if one wants very fast updates then polling is not a good solution.
Hence, a better tool to use is inotail when following a file. Inotail uses inotify to only wake up inotail when a file has been modified, deleted or moved - hence no polling is required. This also means inotail will output the changes to a file almost immediately - unlike tail which by default may wait almost a second before detecting a change.
To install inotail use:
sudo apt-get install inotail
..and use it the same was as tail.
UPDATE: Pete Graner has also informed me that the tailf command is also an inotify based tail -f like replacement too. Just goes to show there are many ways of doing the same thing...
Thursday, 28 January 2010
Using the FIEMAP ioctl() to get file extents
The fiemap ioctl() allows user space programmes to glean the extent information from a file's inode in a fairly direct and fast way.
Mark Fasheh (Suse) has written up a detailed description of this ioctl() in a LWN article, and this is really worth reading.
I've put some quick-and-hacky sample code in my repository to dump out the file extents of given files. This code works in two phases. Step 1, one allocates a fiemap structure and queries the number of extents a file has. Step 2, one re-allocates the fiemap structure with enough space for the extent data to be filled in by the ioctl() and re-issues the ioctl() query to get the requested extent data. Data such as the physical and logical block location and also the size of the extent and extent flags is returned for each extent.
Code such as ureadahead uses fiemap; ureadahead in fact re-probes with the fiemap ioctl() if it detects that the number of extents has increased - just in case the file is growing during the probe.
[ Update ]
It appears that cp has recently been modified to use FIEMAP to detect where holes are in a file to make copying more efficient. However, some users have reported seeing cp corruption issues - the root cause was that FIEMAP was not dealing with regions of a file that have been written to that don't have blocks yet assigned. This is alarming, as the delayed allocation mechanism is used by modern filesystems. This is described in more detail in a recent LWN article.
Wednesday, 20 January 2010
Simple ACPI monitoring tools
Back to basics - here are a couple of quick-and-easy tools for seeing ACPI activity on linux. The first is acpi_listen (from the acpid package) - this tool simply monitors ACPI events and dumps them to stdout:
$ acpi_listen
button/power PWRF 00000080 00000001
ac_adapter AC0 00000080 00000000
The above shows the events when I hit the power button and suspend a HP mini netbook. One can specify the number of events to capture before exiting with the -c flag, and also the number of seconds to wait for with the -t flag. As things go, it's a handy sanity checking tool to make sure things like specific button events get handled correctly.
The next tool is acpitail - this periodically dumps out ACPI status about the battery, fan and temperature to stdout. One can specify the update polling intervals for checking state change using various flags. To install use:
and to use, simply run:
BAT1 remaining capacity: 88% (126 minutes)
Adapter AC0: batteries
temperature THRM: 47 (ok)
Wed Jan 20 20:40:19 2010
temperature THRM: 46 (ok)
Wed Jan 20 20:40:29 2010
temperature THRM: 45 (ok)
..again, it's another simple tool to do some ACPI state sanity checking.
$ acpi_listen
button/power PWRF 00000080 00000001
ac_adapter AC0 00000080 00000000
The above shows the events when I hit the power button and suspend a HP mini netbook. One can specify the number of events to capture before exiting with the -c flag, and also the number of seconds to wait for with the -t flag. As things go, it's a handy sanity checking tool to make sure things like specific button events get handled correctly.
The next tool is acpitail - this periodically dumps out ACPI status about the battery, fan and temperature to stdout. One can specify the update polling intervals for checking state change using various flags. To install use:
sudo apt-get install acpitail
and to use, simply run:
$ acpitail
Wed Jan 20 20:40:14 2010BAT1 remaining capacity: 88% (126 minutes)
Adapter AC0: batteries
temperature THRM: 47 (ok)
Wed Jan 20 20:40:19 2010
temperature THRM: 46 (ok)
Wed Jan 20 20:40:29 2010
temperature THRM: 45 (ok)
..again, it's another simple tool to do some ACPI state sanity checking.
Tuesday, 12 January 2010
Fixing the BBC clickbits sign off
The other week I E-mailed the BBC to grumble (in a very tongue-in-cheek manner) about the sign-off tag line in their Clickbits technology news video. The sign-off goes:
"Updates have now been installed - you may reboot"
I helpfully pointed out that this was Microsoft-centric and Linux users generally don't have to reboot after installing updates. I suggested an alternative tag line of:
"Updates have now been installed, unfortunately Microsoft users are forced to reboot to get the goodness."
Today I received a friendly E-mail from Zoe Kleinman, the Clickbits Producer, politely asking me to check out the following URL: http://news.bbc.co.uk/1/hi/technology/8449159.stm
...behold, at the end of the video, the sign-off tag line is now:
"Updates have now been installed, you may restart, unless you are using Linux, in which case you don't have too."
Excellent! I'm really glad the BBC is listening! Kudos to Zoe for being so enlightened!
Thursday, 7 January 2010
Raving about WorkRave
I'm now back from having several weeks rest after a major operation on my neck to replace a slipped disc with a Titanium one. The operation went well, I just need to now focus on doing a lot of regular neck exercises through the day to keep me from seizing up.

Thankfully I found a neat little application called WorkRave. WorkRave is designed to help stop repetitive strain injury (RSI), but I've been using it to tell me when to have short breaks to exercise my neck and back.
To install it on a Ubuntu system use:
sudo apt-get install workrave
WorkRave allows one to configure short micro-breaks, rest breaks and daily work limits. At the break intervals, one is presented a set of short exercises, such neck turning, shoulder-arm stretches, should movements, neck tilts, etc...


I'd recommend using this application if you need regular desk-exercise and don't mind a little bit of regular nagging from the computer. Give it a try! It's certainly helped me!
Subscribe to:
Comments (Atom)