Friday, 2 October 2009
Amusing Linux vs Windows comparison blog article
Ubuntucat has an amusing tongue-in-cheek comparison of installing software on Linux and Windows in this blog article. Made me laugh.
Monitoring top bandwidth usage of a network interface
Paul Warren's iftop tool provides quick-n-easy way of seeing the top bandwidth hogging connections on a specified network interface. Just like other top like tools, it's a text console based tool.
To install, use:
sudo apt-get install iftop
To monitor traffic on my wifi interface wlan1, I used:
sudo iftop -i wlan1
..note that specifying more than one interface causes it to segfault :-(
It has a few interactive commands, press 'h' to get help, and 'h' again to toggle back out of the help screen. For example, the 't' key allows one to cycle through send/receive display modes, and the 'p' key toggles on/off the port number on the connection display. Naturally, the 'q' key quits the application.

The bottom of the screen displays a summary of the TX/RX statistics including cumulative totals and peak transfer rates. All in all quite a helpful little tool.
Thursday, 1 October 2009
Getting sense out of the sensors applet
There are times when I drive my laptop CPU really hard, for example compressing Gigs of data or running QEMU, and it would be useful to see how hot my processor is actually getting. This is where sensors-applet is useful - it has the ability to show the core temperature of the CPU and HDD if one has the appropriate hardware sensors and drivers installed. However, getting it configured requires a little bit of hand-holding to get it working.
Firstly, install sensors-applet using:
sudo apt-get install sensors-applet
..this will also install the lm-sensors tools.
Next, one needs to probe the H/W to find the appropriate drivers required to be able to sense CPU and HDD temperatures. To do this use:
sudo sensors-detect
This will ask you if you want to probe and scan various I2C, PCI and SMBus adaptors, so answer the probing questions with respect to the hardware you have in your machine. On my machine I answered "YES" to every question, your mileage may vary.
At the end of the probing, sensors-detect will print out some lines that you need to add to /etc/modules. Using sudo, edit /etc/modules and add these lines. Then reboot your machine.
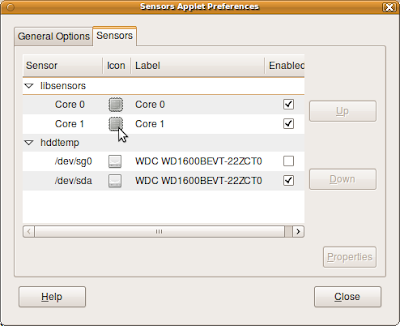
Once you are logged in again, right click on the top Gnome panel and select "Add to Panel.." and scroll down and select the "Hardware Sensors Monitor". Once it's added to the panel, right click on it and select "Preferences". On the Sensors Applet Preferences panel, select the "Sensors" tab and then select the appropriate CPU and HDD devices to monitor.
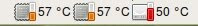
Once this is done, you will hopefully be able to see your CPU and HDD temperatures rise and fall as you work on your machine:
From the command line one can also get the current sensor data using the sensors command, e.g.:
$ sensors
coretemp-isa-0000
Adapter: ISA adapter
Core 0: +58.0°C (high = +85.0°C, crit = +85.0°C)
coretemp-isa-0001
Adapter: ISA adapter
Core 1: +57.0°C (high = +85.0°C, crit = +85.0°C)
Hopefully I won't see my CPU get to 85 degrees C, but now at least I can keep my eye on how hot it's getting :-)
Firstly, install sensors-applet using:
sudo apt-get install sensors-applet
..this will also install the lm-sensors tools.
Next, one needs to probe the H/W to find the appropriate drivers required to be able to sense CPU and HDD temperatures. To do this use:
sudo sensors-detect
This will ask you if you want to probe and scan various I2C, PCI and SMBus adaptors, so answer the probing questions with respect to the hardware you have in your machine. On my machine I answered "YES" to every question, your mileage may vary.
At the end of the probing, sensors-detect will print out some lines that you need to add to /etc/modules. Using sudo, edit /etc/modules and add these lines. Then reboot your machine.
Once you are logged in again, right click on the top Gnome panel and select "Add to Panel.." and scroll down and select the "Hardware Sensors Monitor". Once it's added to the panel, right click on it and select "Preferences". On the Sensors Applet Preferences panel, select the "Sensors" tab and then select the appropriate CPU and HDD devices to monitor.

Once this is done, you will hopefully be able to see your CPU and HDD temperatures rise and fall as you work on your machine:

From the command line one can also get the current sensor data using the sensors command, e.g.:
$ sensors
coretemp-isa-0000
Adapter: ISA adapter
Core 0: +58.0°C (high = +85.0°C, crit = +85.0°C)
coretemp-isa-0001
Adapter: ISA adapter
Core 1: +57.0°C (high = +85.0°C, crit = +85.0°C)
Hopefully I won't see my CPU get to 85 degrees C, but now at least I can keep my eye on how hot it's getting :-)
More info about Ubuntu 10.04 Lucid Lynx
For those who haven't seen it yet, here is Mark Shuttleworth's announcement of Ubuntu 10.04 Lucid Lynx.
Subscribe to:
Posts (Atom)